CSY-023. Projecting voter turnout in midterm elections using machine learning case studies, machine learningDavid WhiteJuly 5, 2022SQL, Google BigQuery, Python, Adobe InDesign, pandas, scikit-learn, seaborn
CSY-022. A data analysis and presentation on targeting voters in a political campaign. case studies, data visualizationDavid WhiteAugust 5, 2021Google Data Studio, SQL, Google BigQuery, dashboard
CSY-020. An infographic that briefly summarizes a large set of data. case studies, data visualizationDavid WhiteJuly 19, 2021data graphic
CSY-019. A spreadsheet and a set of data graphics that track progress over time. case studies, data visualization, data analysis, reports & presentationsDavid WhiteJune 19, 2021Harlem Link Charter School, spreadsheet, Google Sheets
CSY-018. A cloud-based spreadsheet that helps stakeholders conduct collaborative data meetings. case studies, data visualization, data analysis, reports & presentationsDavid WhiteJune 18, 2021Harlem Link Charter School, spreadsheet, Google Sheets
CSY-017. A suite of online dashboards that give all members of an organization access to actionable information. case studies, data visualizationDavid WhiteJune 5, 2021Jazzfuel.com, dashboard, Google Data Studio
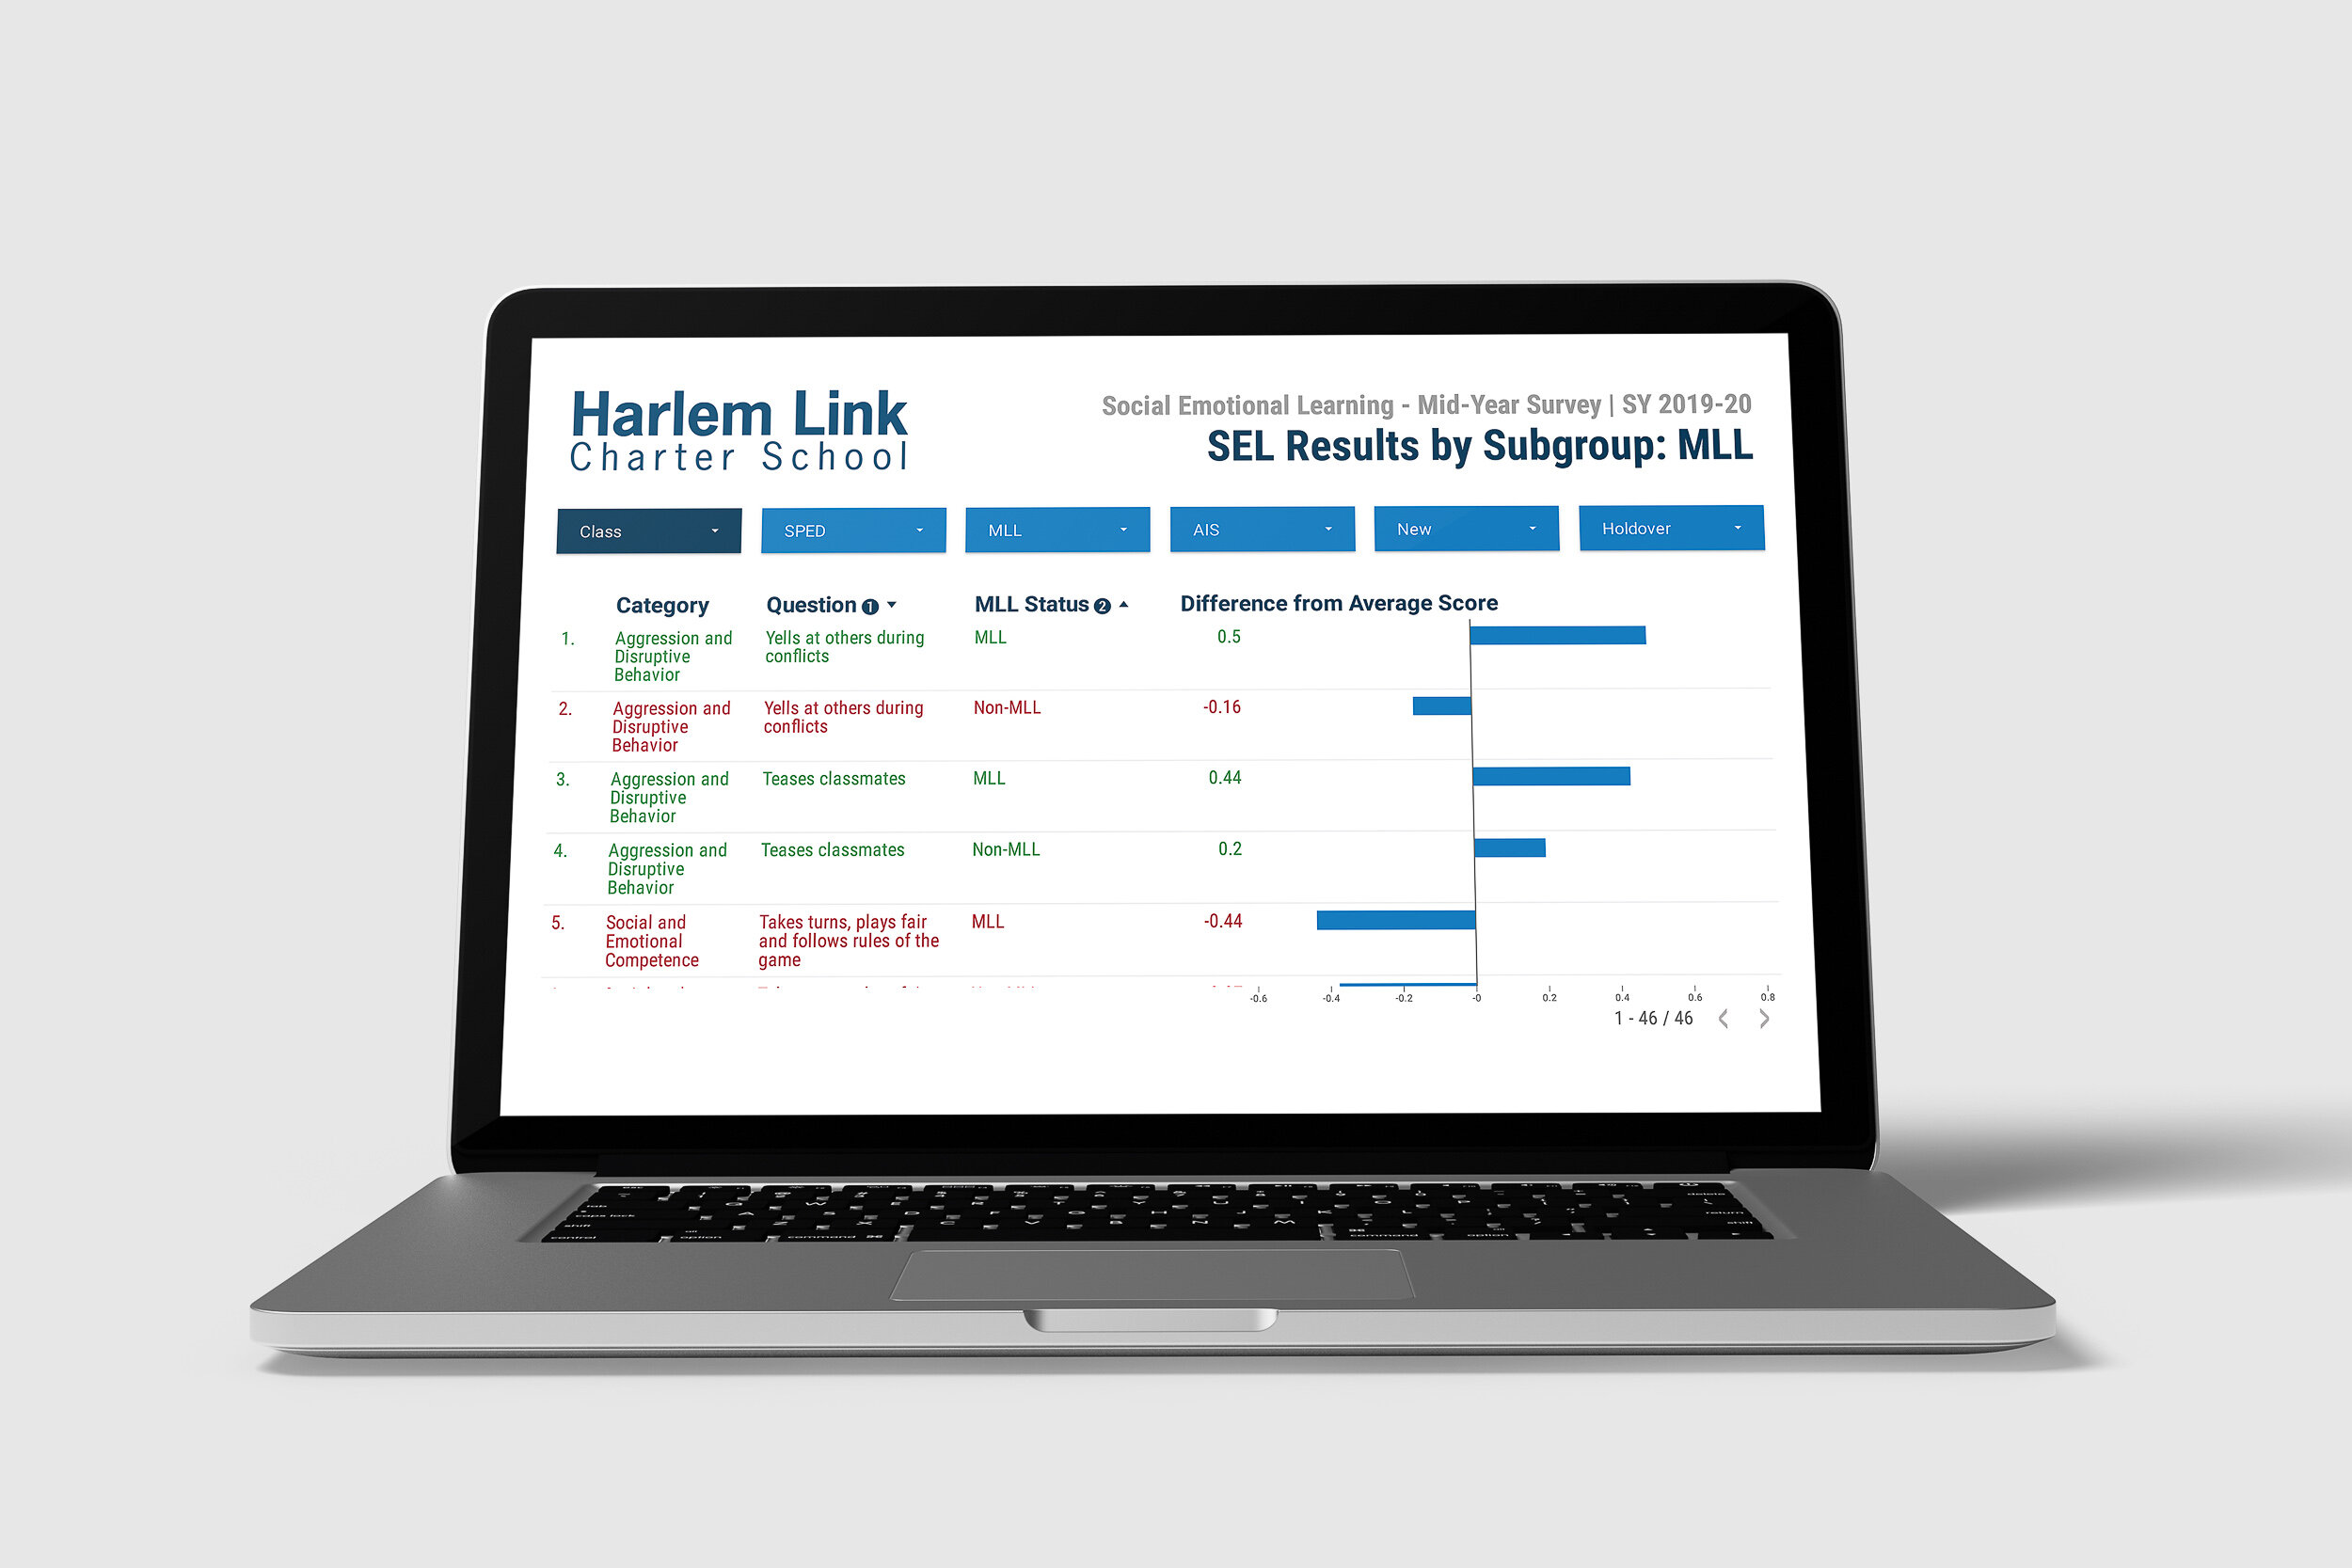
CSY-016. A data report that provides insight into the results of a recent survey. case studies, data visualizationDavid WhiteJune 5, 2021Jazzfuel.com, dashboard, Google Data Studio, report
CSY-015. Cloud-based data reports that put timely information at your fingertips. case studies, data visualizationDavid WhiteJune 5, 2021Jazzfuel.com, dashboard, Google Data Studio
CSY-014. An exploratory data analysis of public school demographics. case studies, data visualizationDavid WhiteMay 3, 2021exploratory data analysis, Python, report
CSY-013. An interactive data visualization that communicates the results of a survey. case studies, data visualizationDavid WhiteJanuary 13, 2021Jazzfuel.com, dashboard, Google Data Studio, data graphic
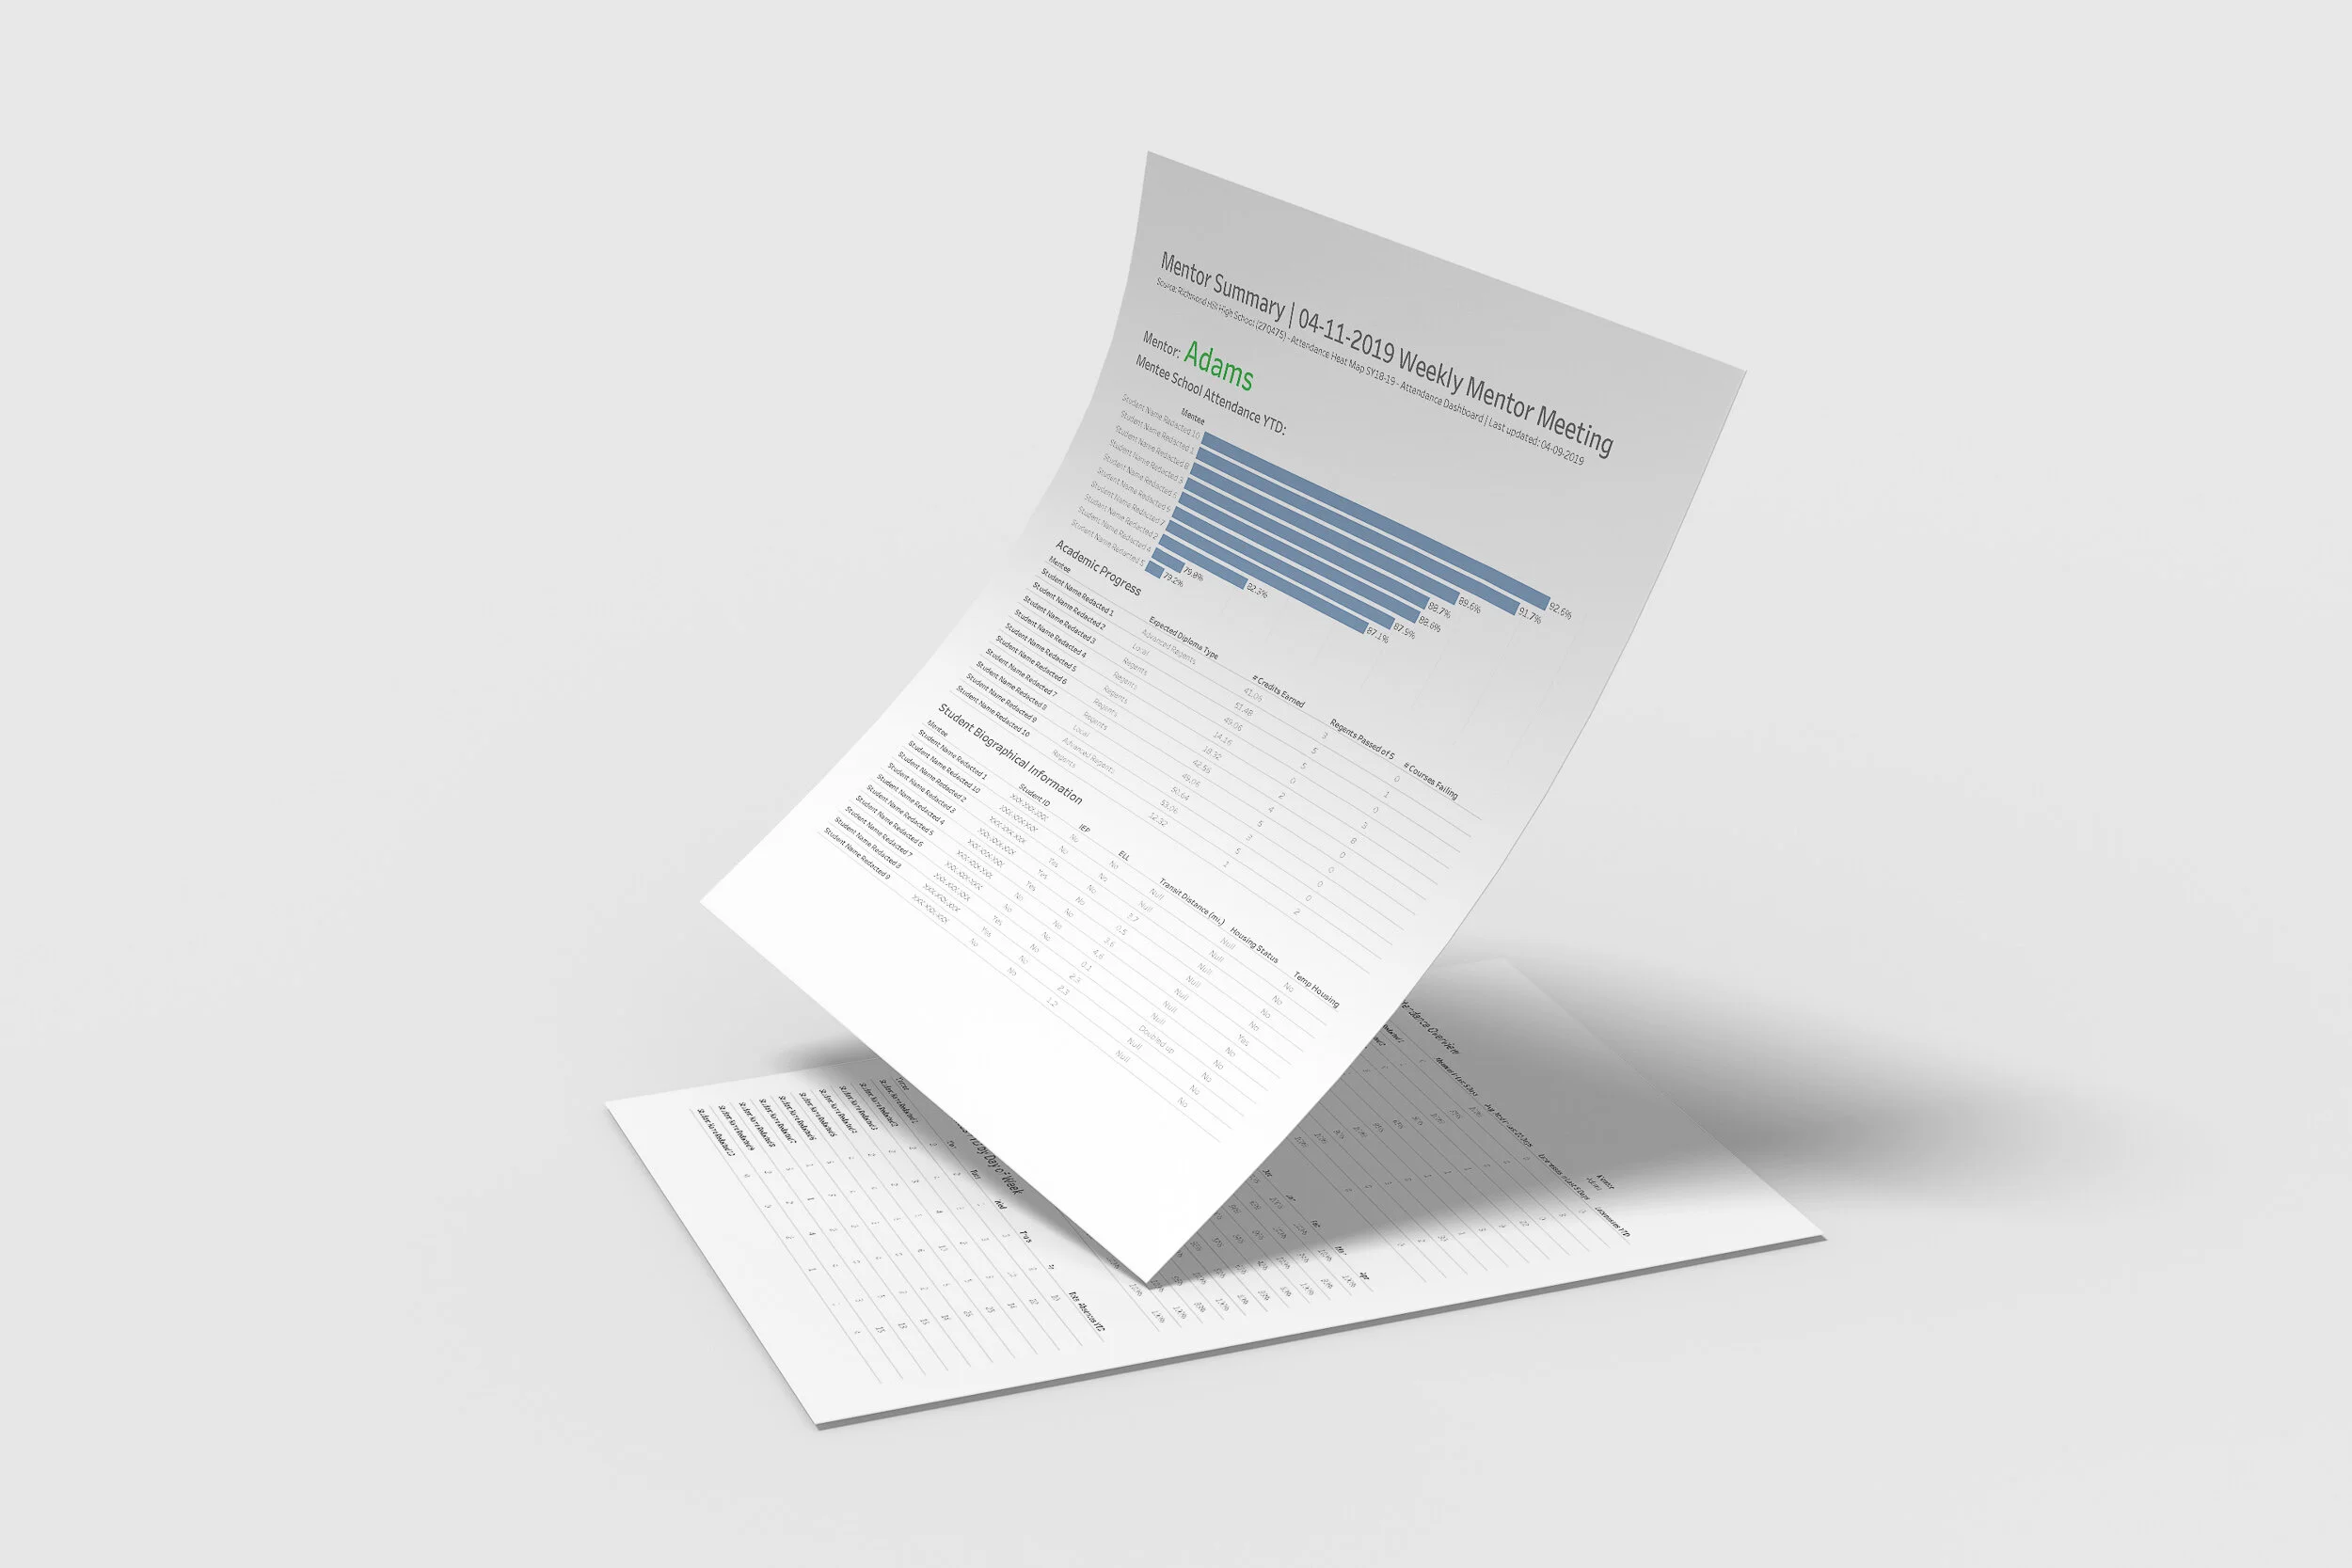
CSY-011. A concise weekly report that shows progress toward goals for a youth mentorship program. case studies, reports & presentationsDavid WhiteJanuary 11, 2021South Asian Youth Action (SAYA!), report design, Tableau, report
CSY-005. A visual that shows the effect that an external challenge is having on a nonprofit program. case studies, data visualizationDavid WhiteJanuary 5, 2021South Asian Youth Action (SAYA!), correlation, line graph, Tableau, data graphic
CSY-004. A visual that illustrates the recent trends happening within a school's area of focus. case studies, data visualizationDavid WhiteJanuary 4, 2021South Asian Youth Action (SAYA!), change-over-time, magnitude, bar graph, Tableau, data graphic
CSY-003. A visual that tracks the effectiveness of an intervention program for at-risk youth. case studies, data visualizationDavid WhiteJanuary 3, 2021South Asian Youth Action (SAYA!), change-over-time, line graph, Tableau, data graphic
CSY-002. A data analysis tool that helps teachers deliver targeted instruction. case studies, data visualizationDavid WhiteJanuary 2, 2021Global Community Charter School, Microsoft Excel, spreadsheet
CSY-001. An online data dashboard for a nonprofit board of trustees. case studies, data visualizationDavid WhiteJanuary 1, 2021Global Community Charter School, dashboard, Tableau