4. Blog: Insights, Made Fresh Daily
Insights, Made Fresh Daily is my data visualization blog. I design and publish one new data visualization and data article here each day, every day.
4. INSIGHTS, MADE FRESH DAILY

Insights, Made Fresh Daily is my daily blog of data visualizations and data-based articles. I research publicly-available, open datasets—such as those published by the City of New York and the United Nations—and I use them to produce my own data graphics and concise articles. My goal as a data writer is to extract pieces of useful, practical information from those complex (and often enormous) datasets and then communicate to the reader what the data means and why it matters.
CURRENT PROJECT
January 1–JuNE 30, 2023
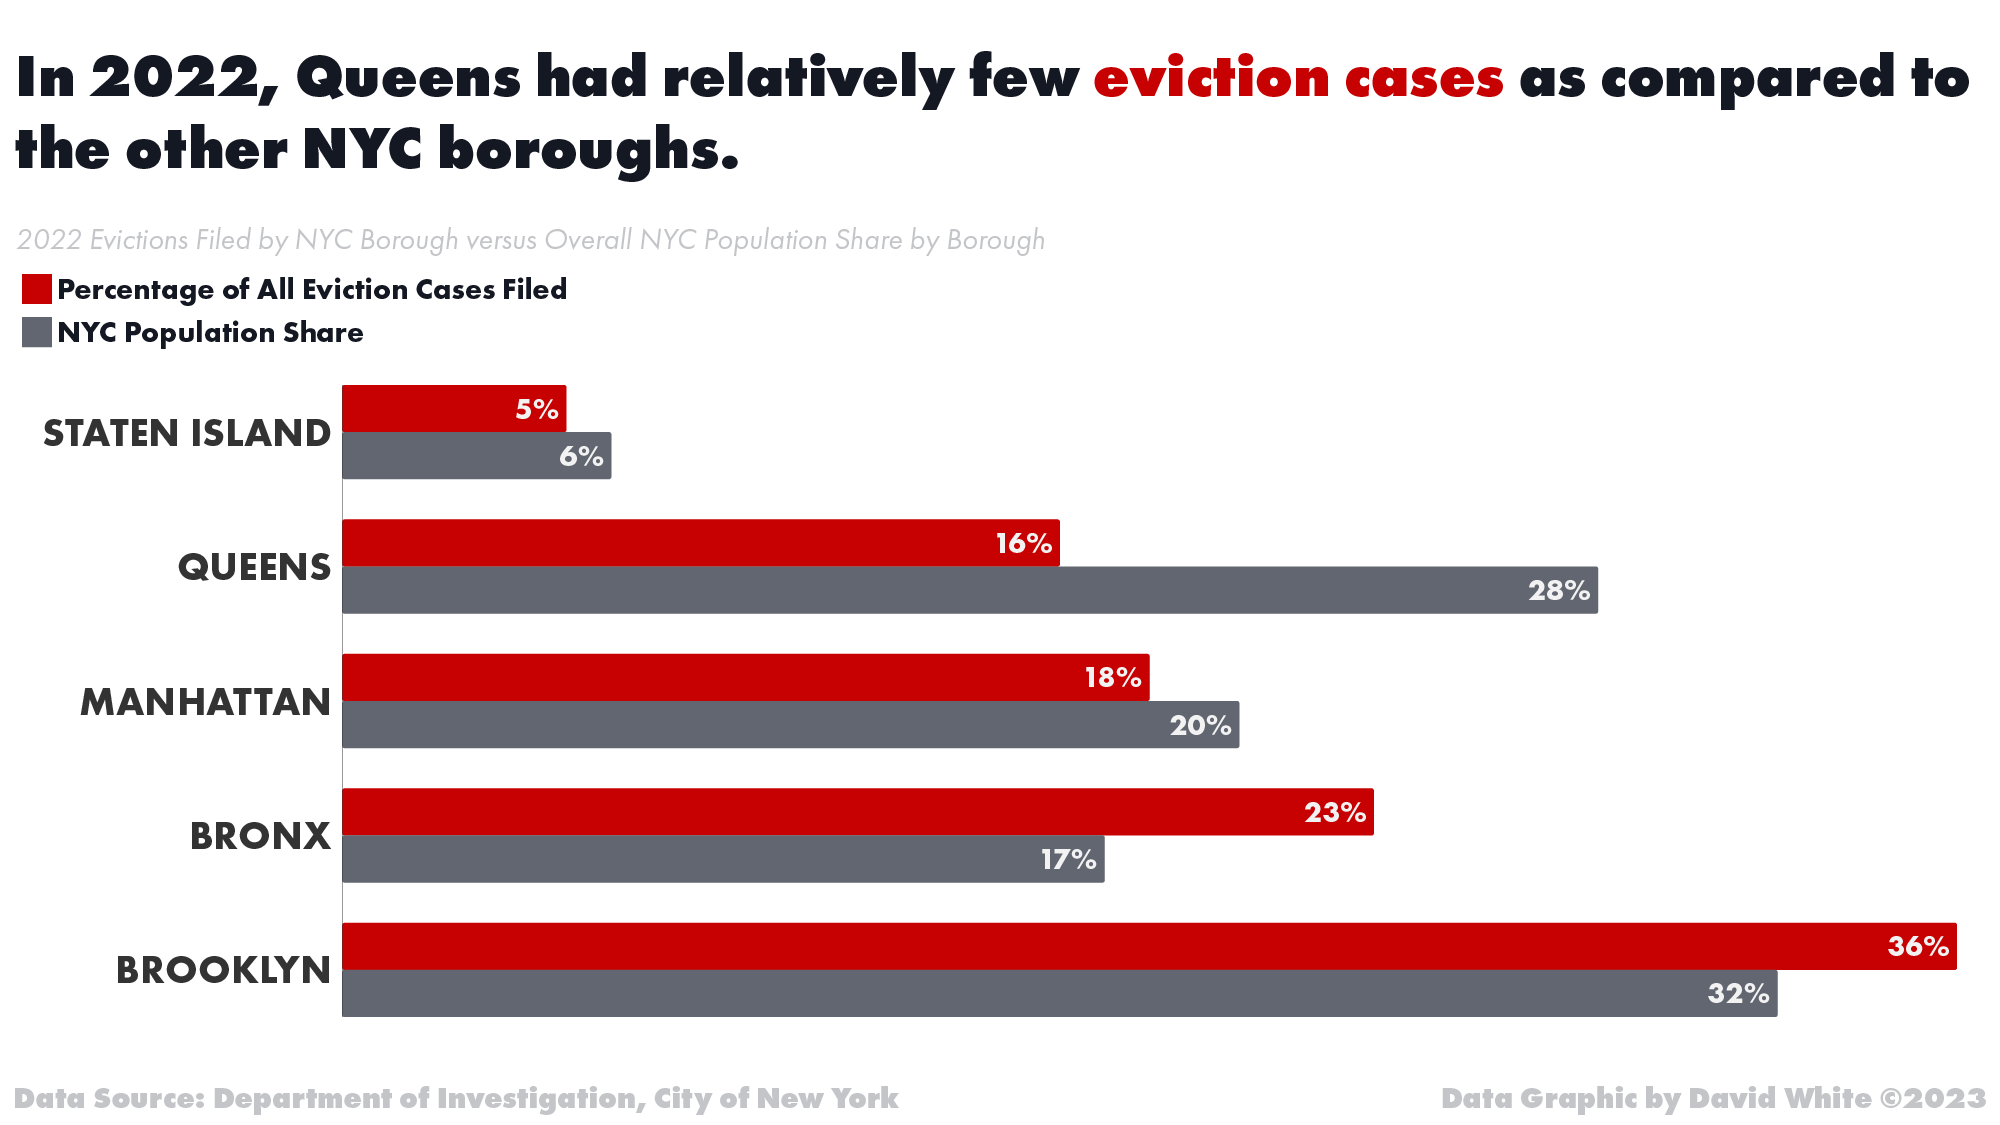
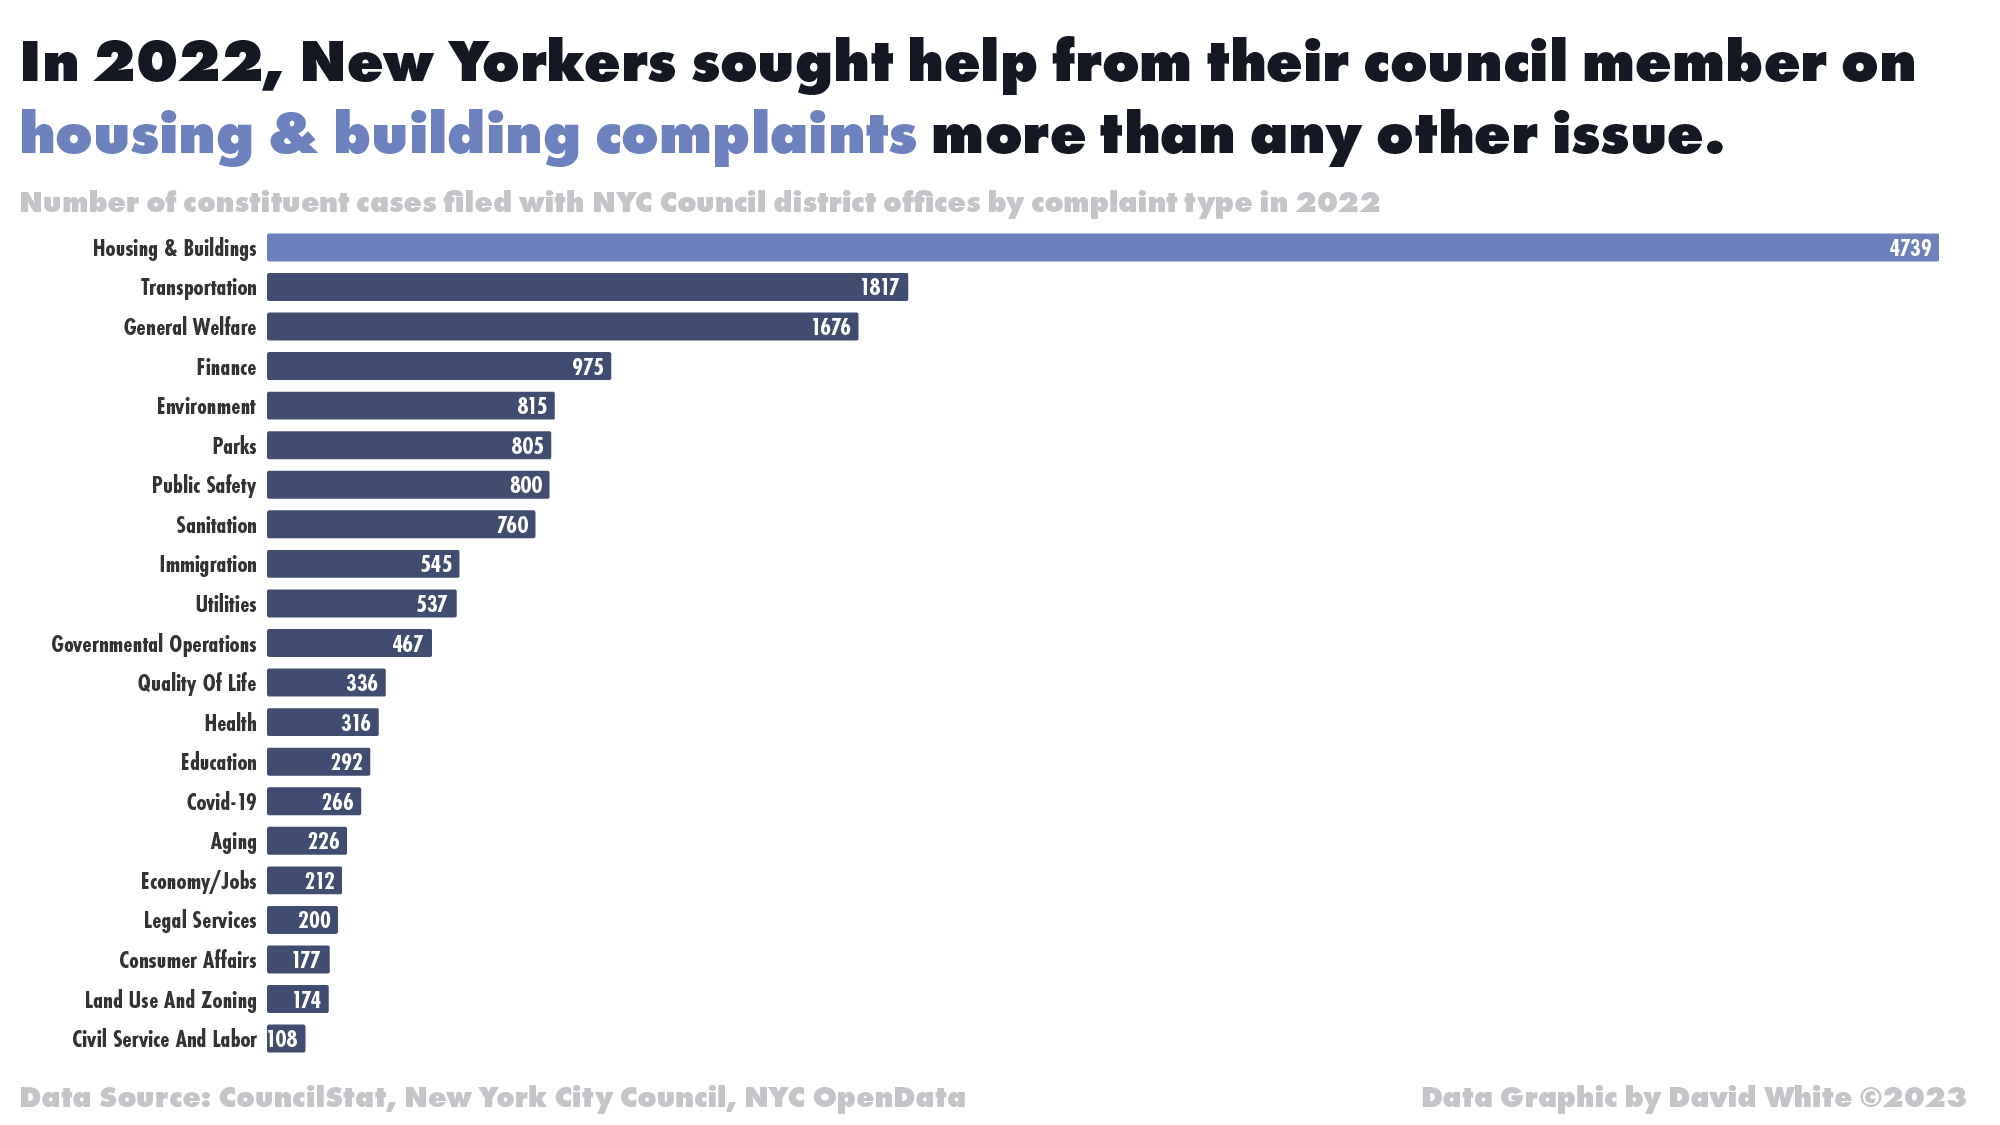
Exploring NYC Open Data: City Government


Previous PROJECTS
JULy 1–31, 2021
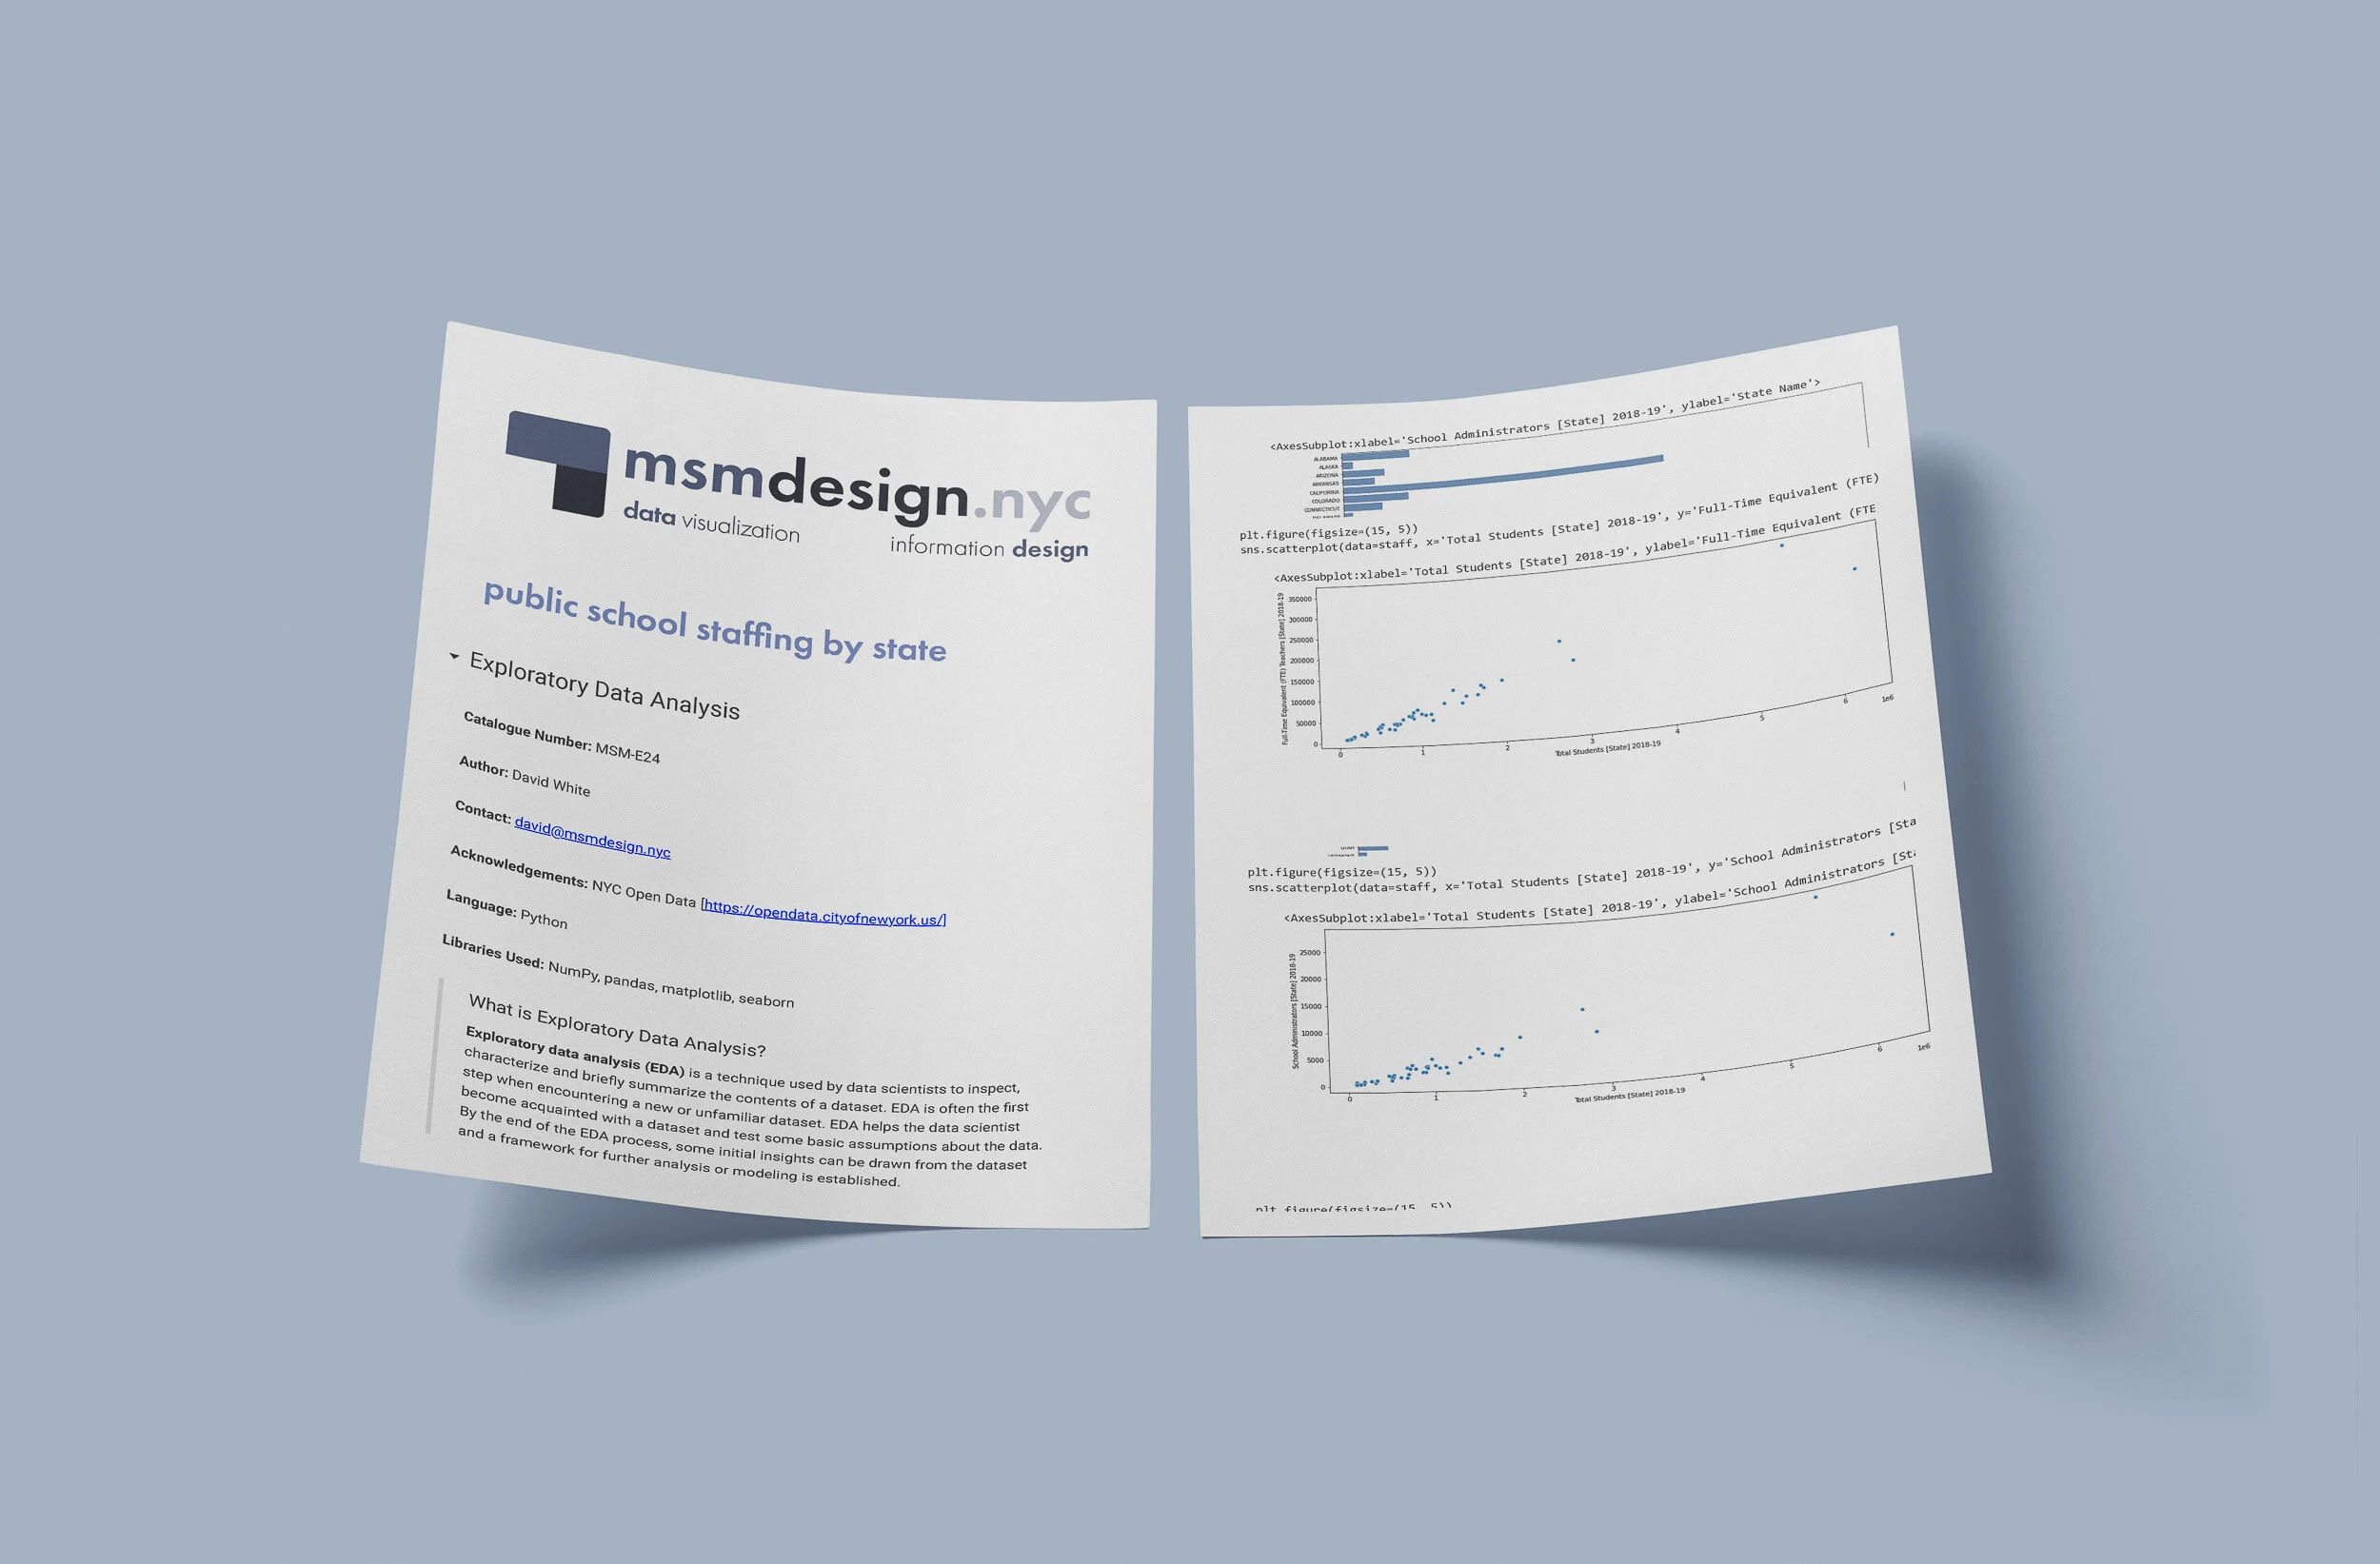
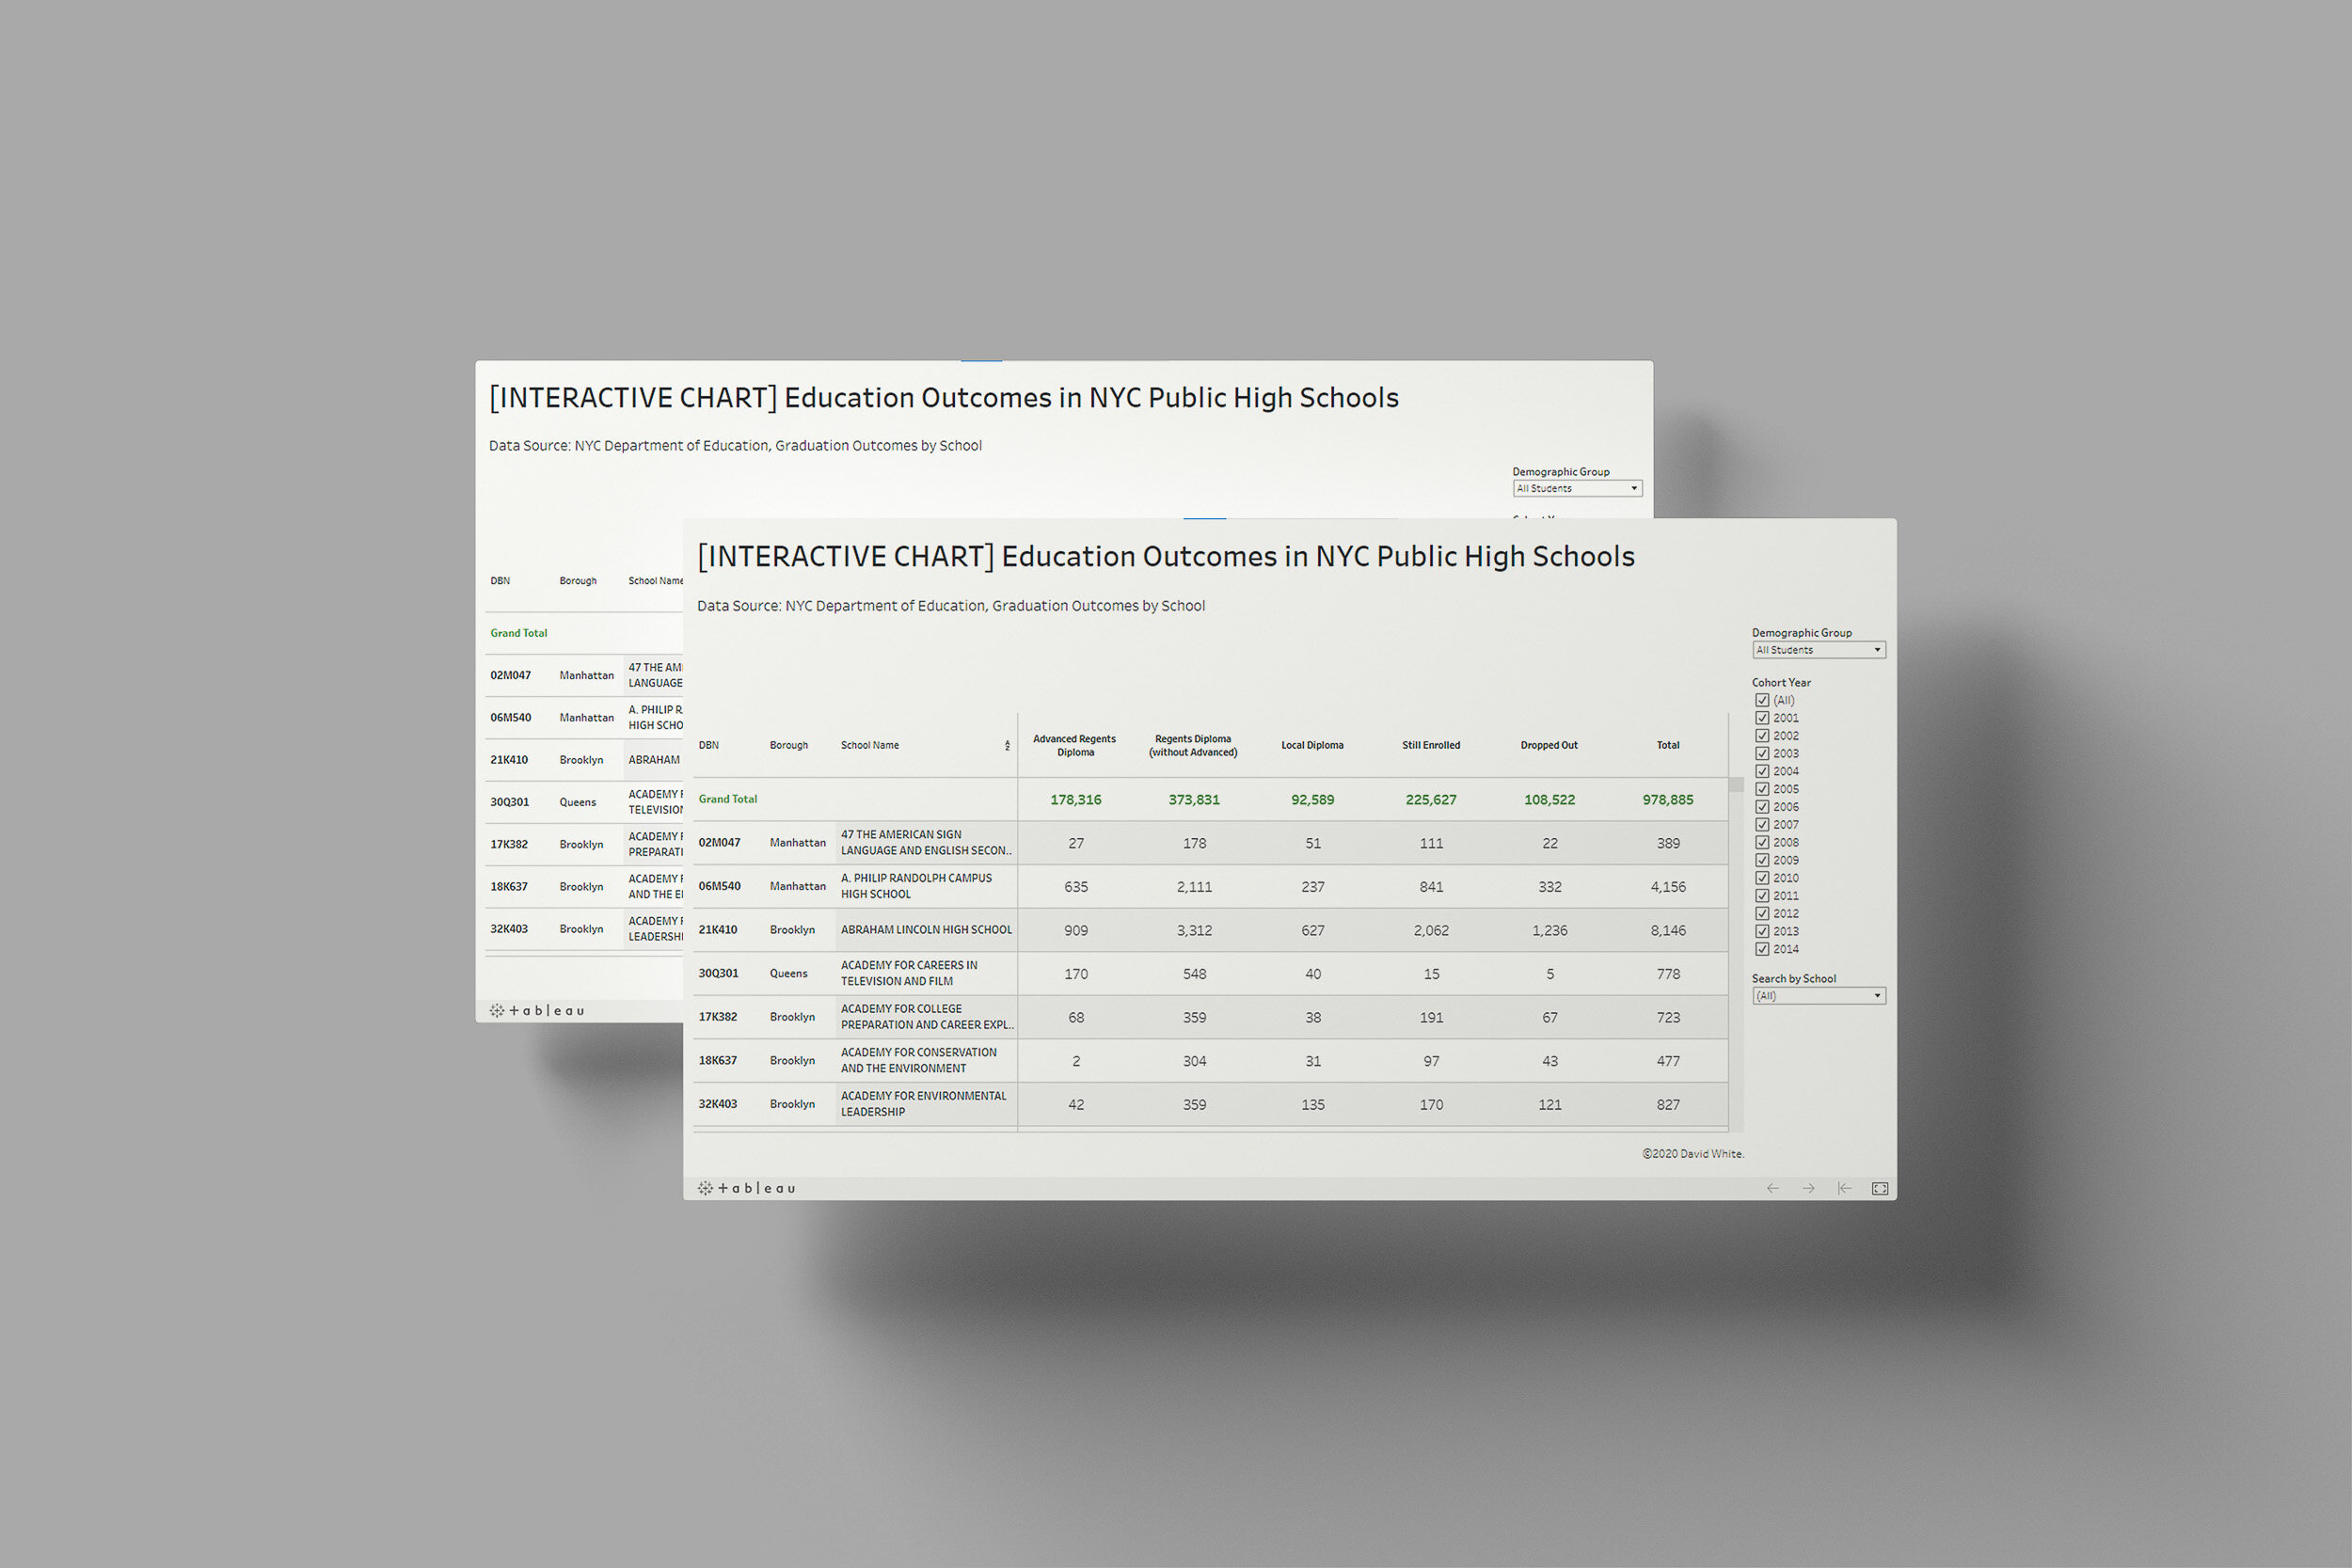
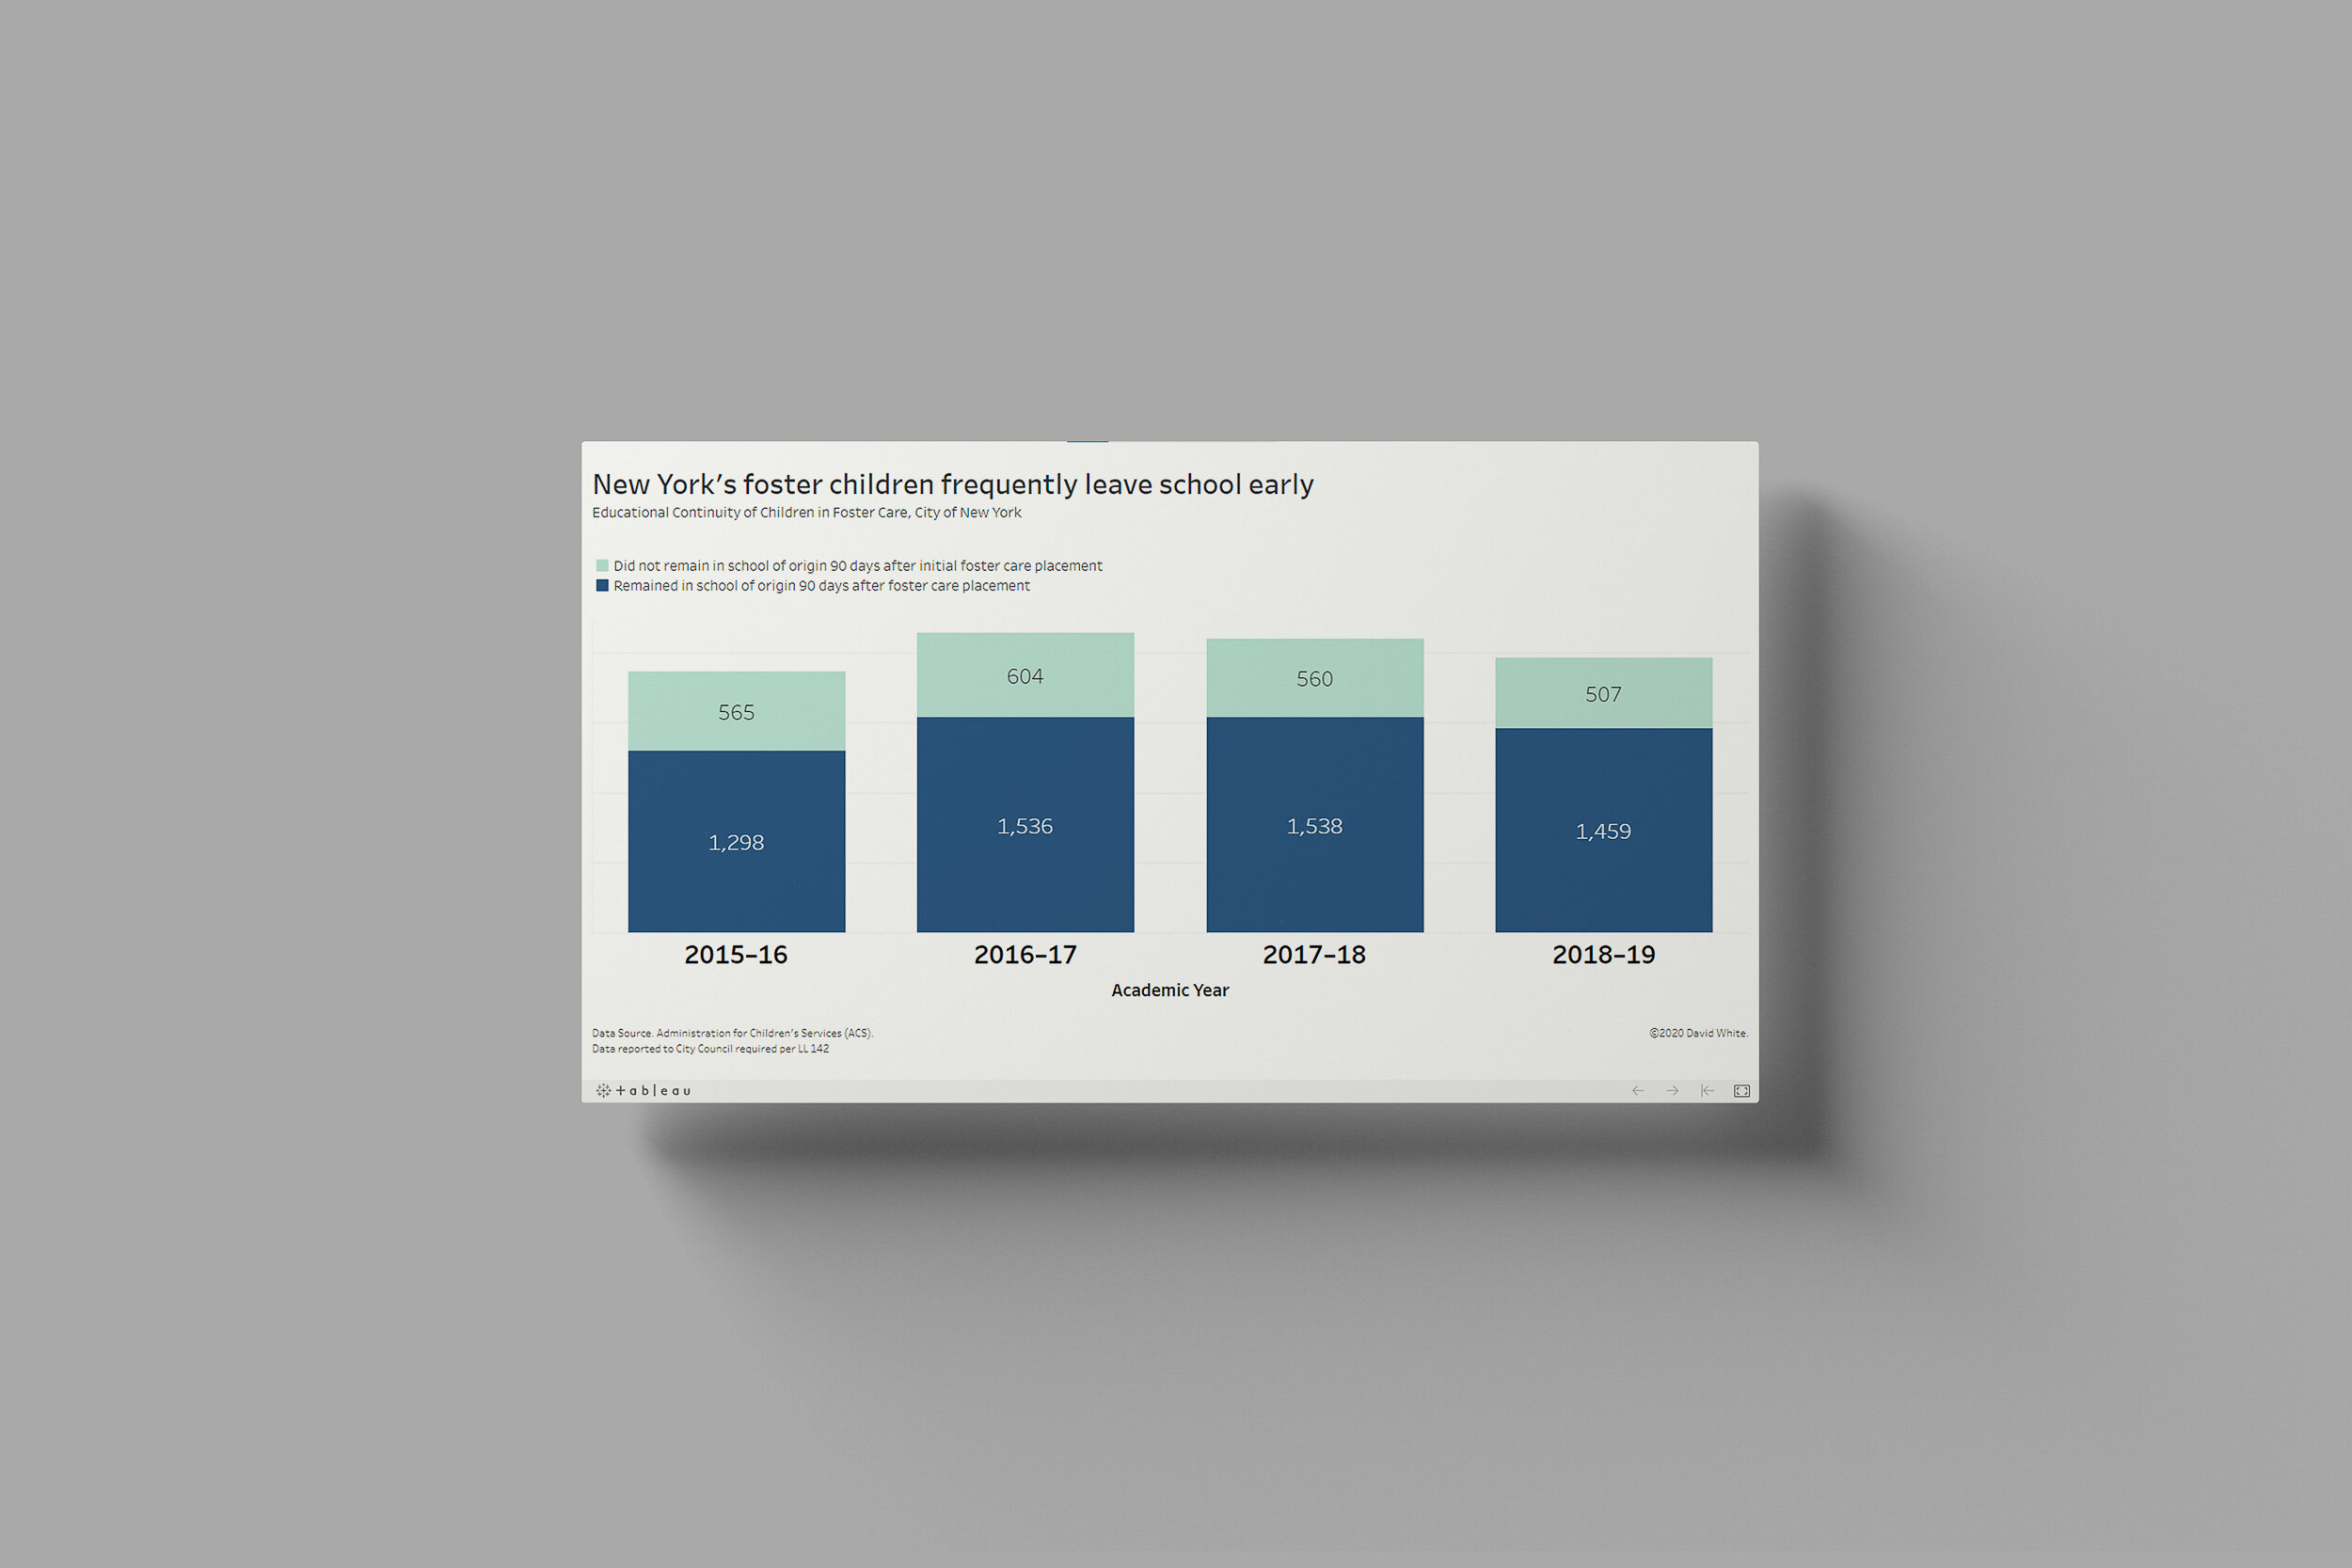
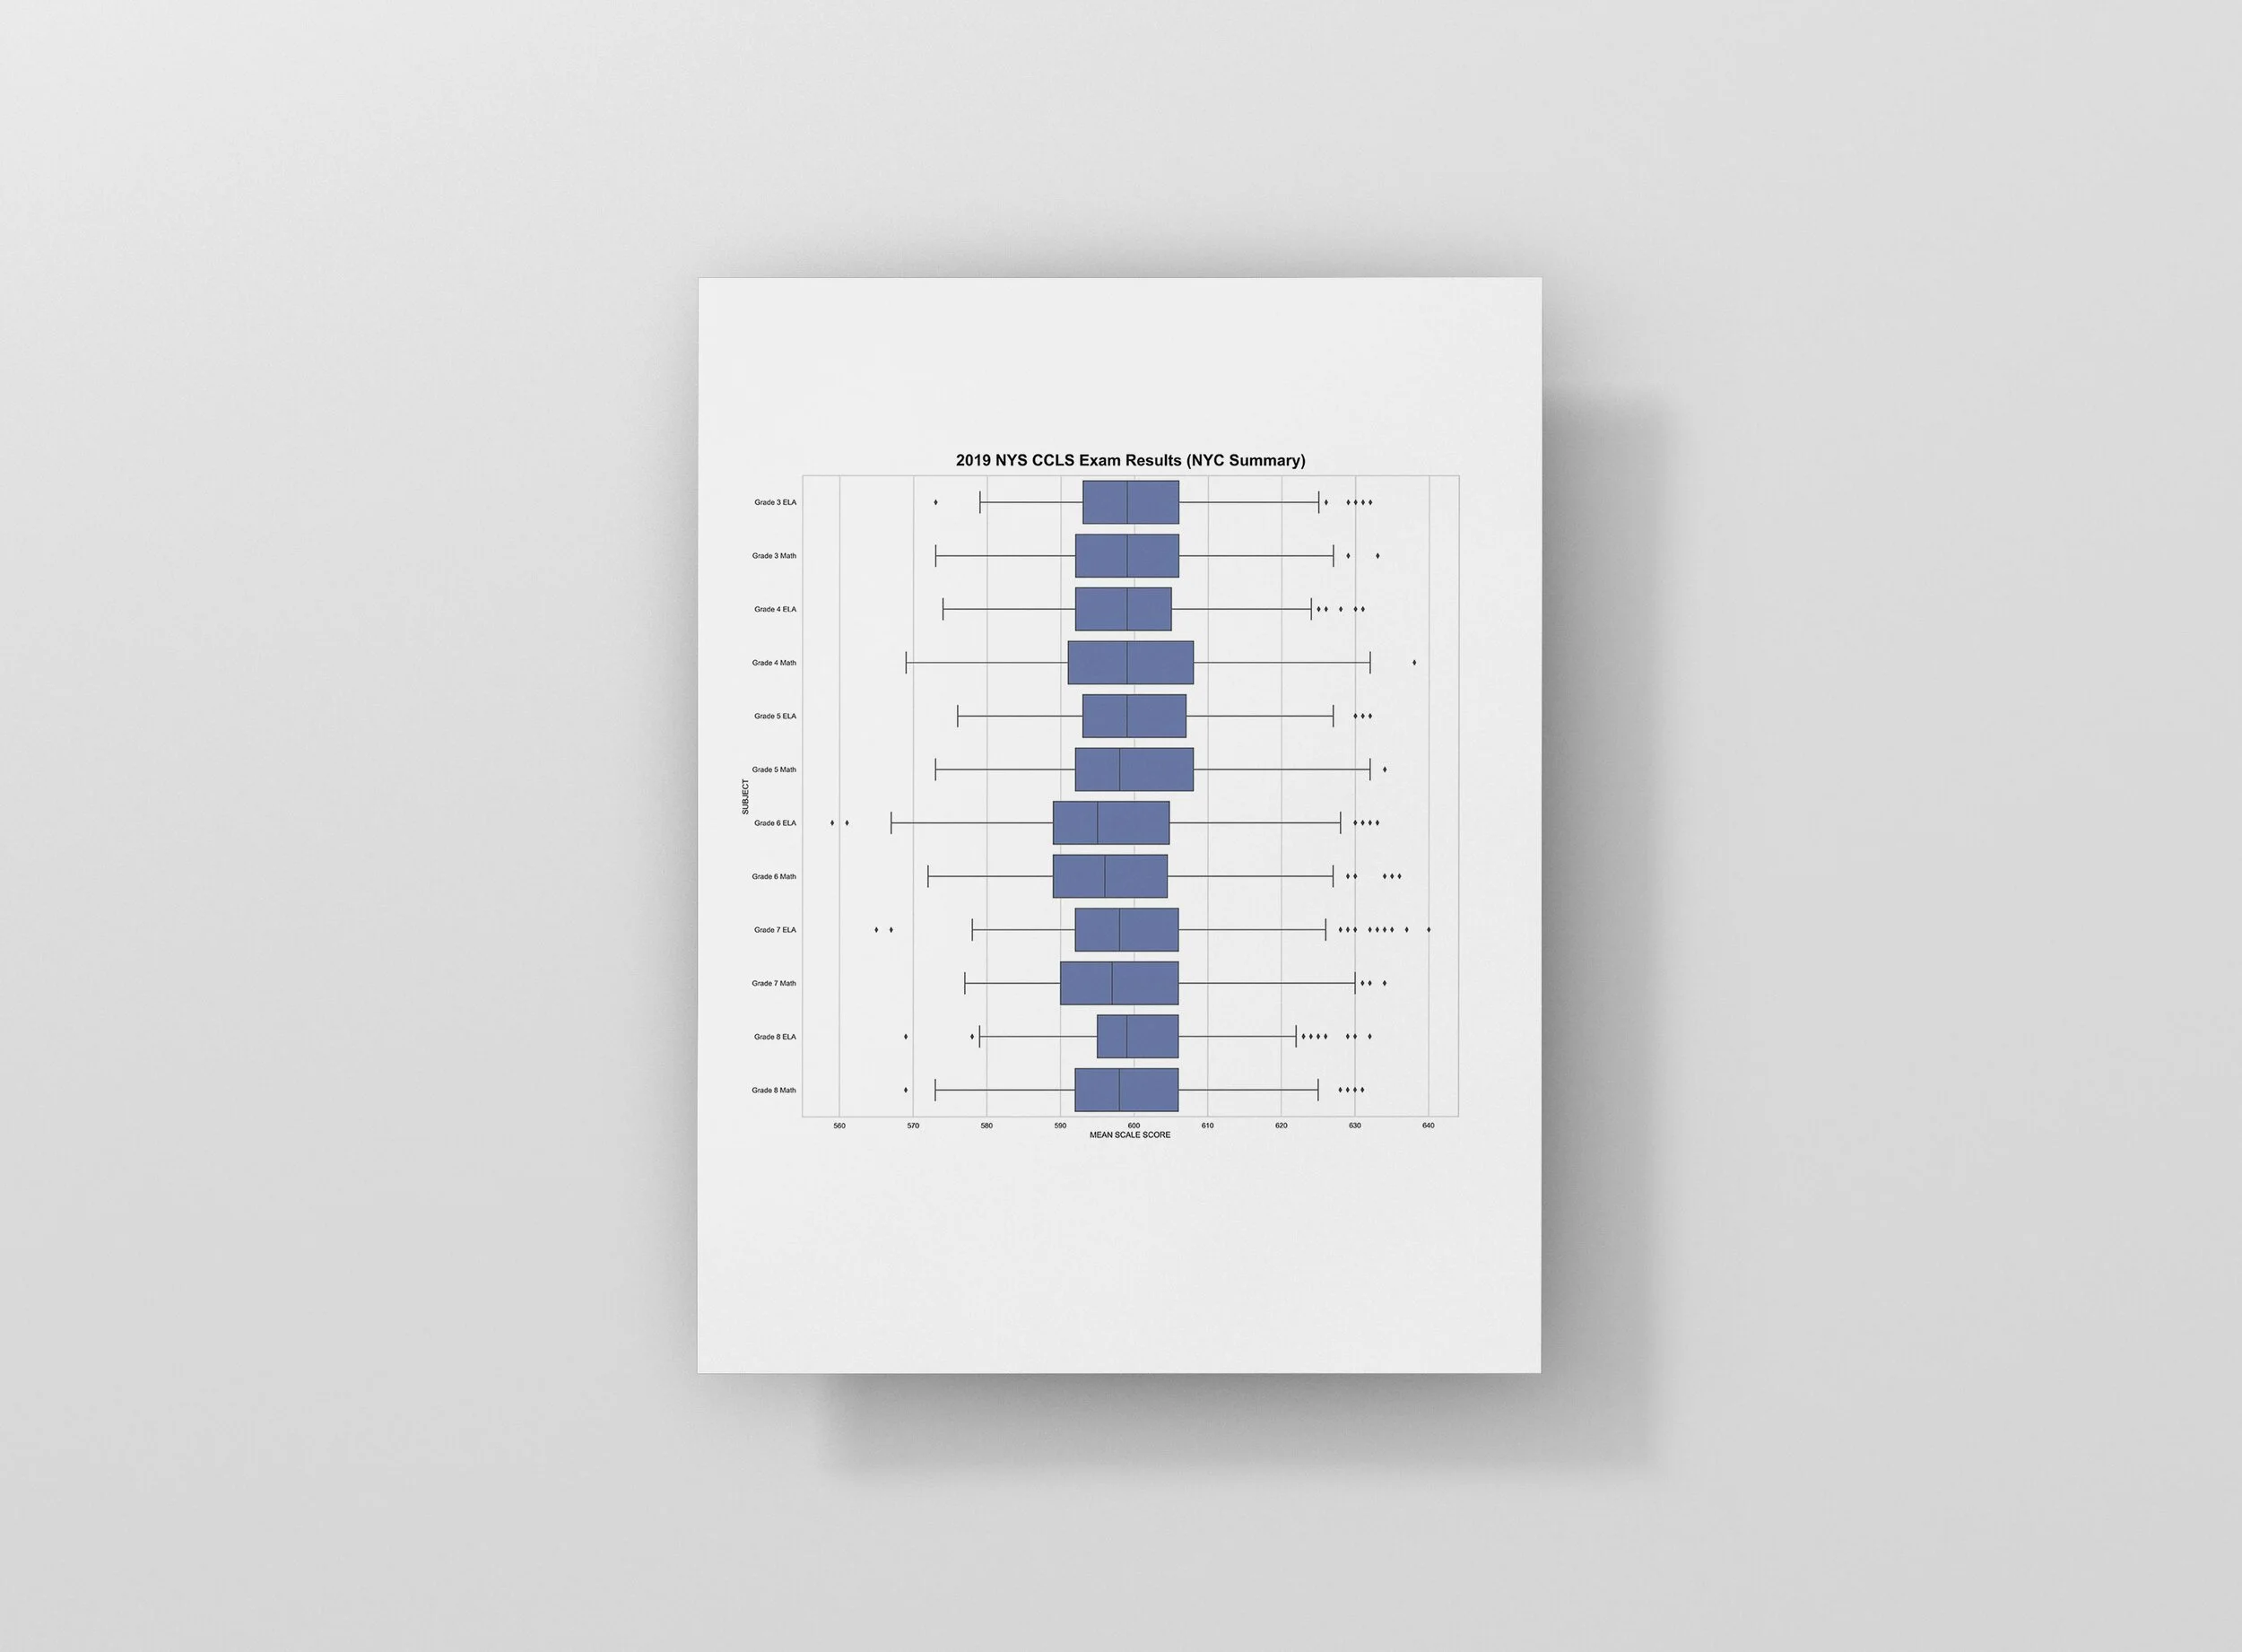
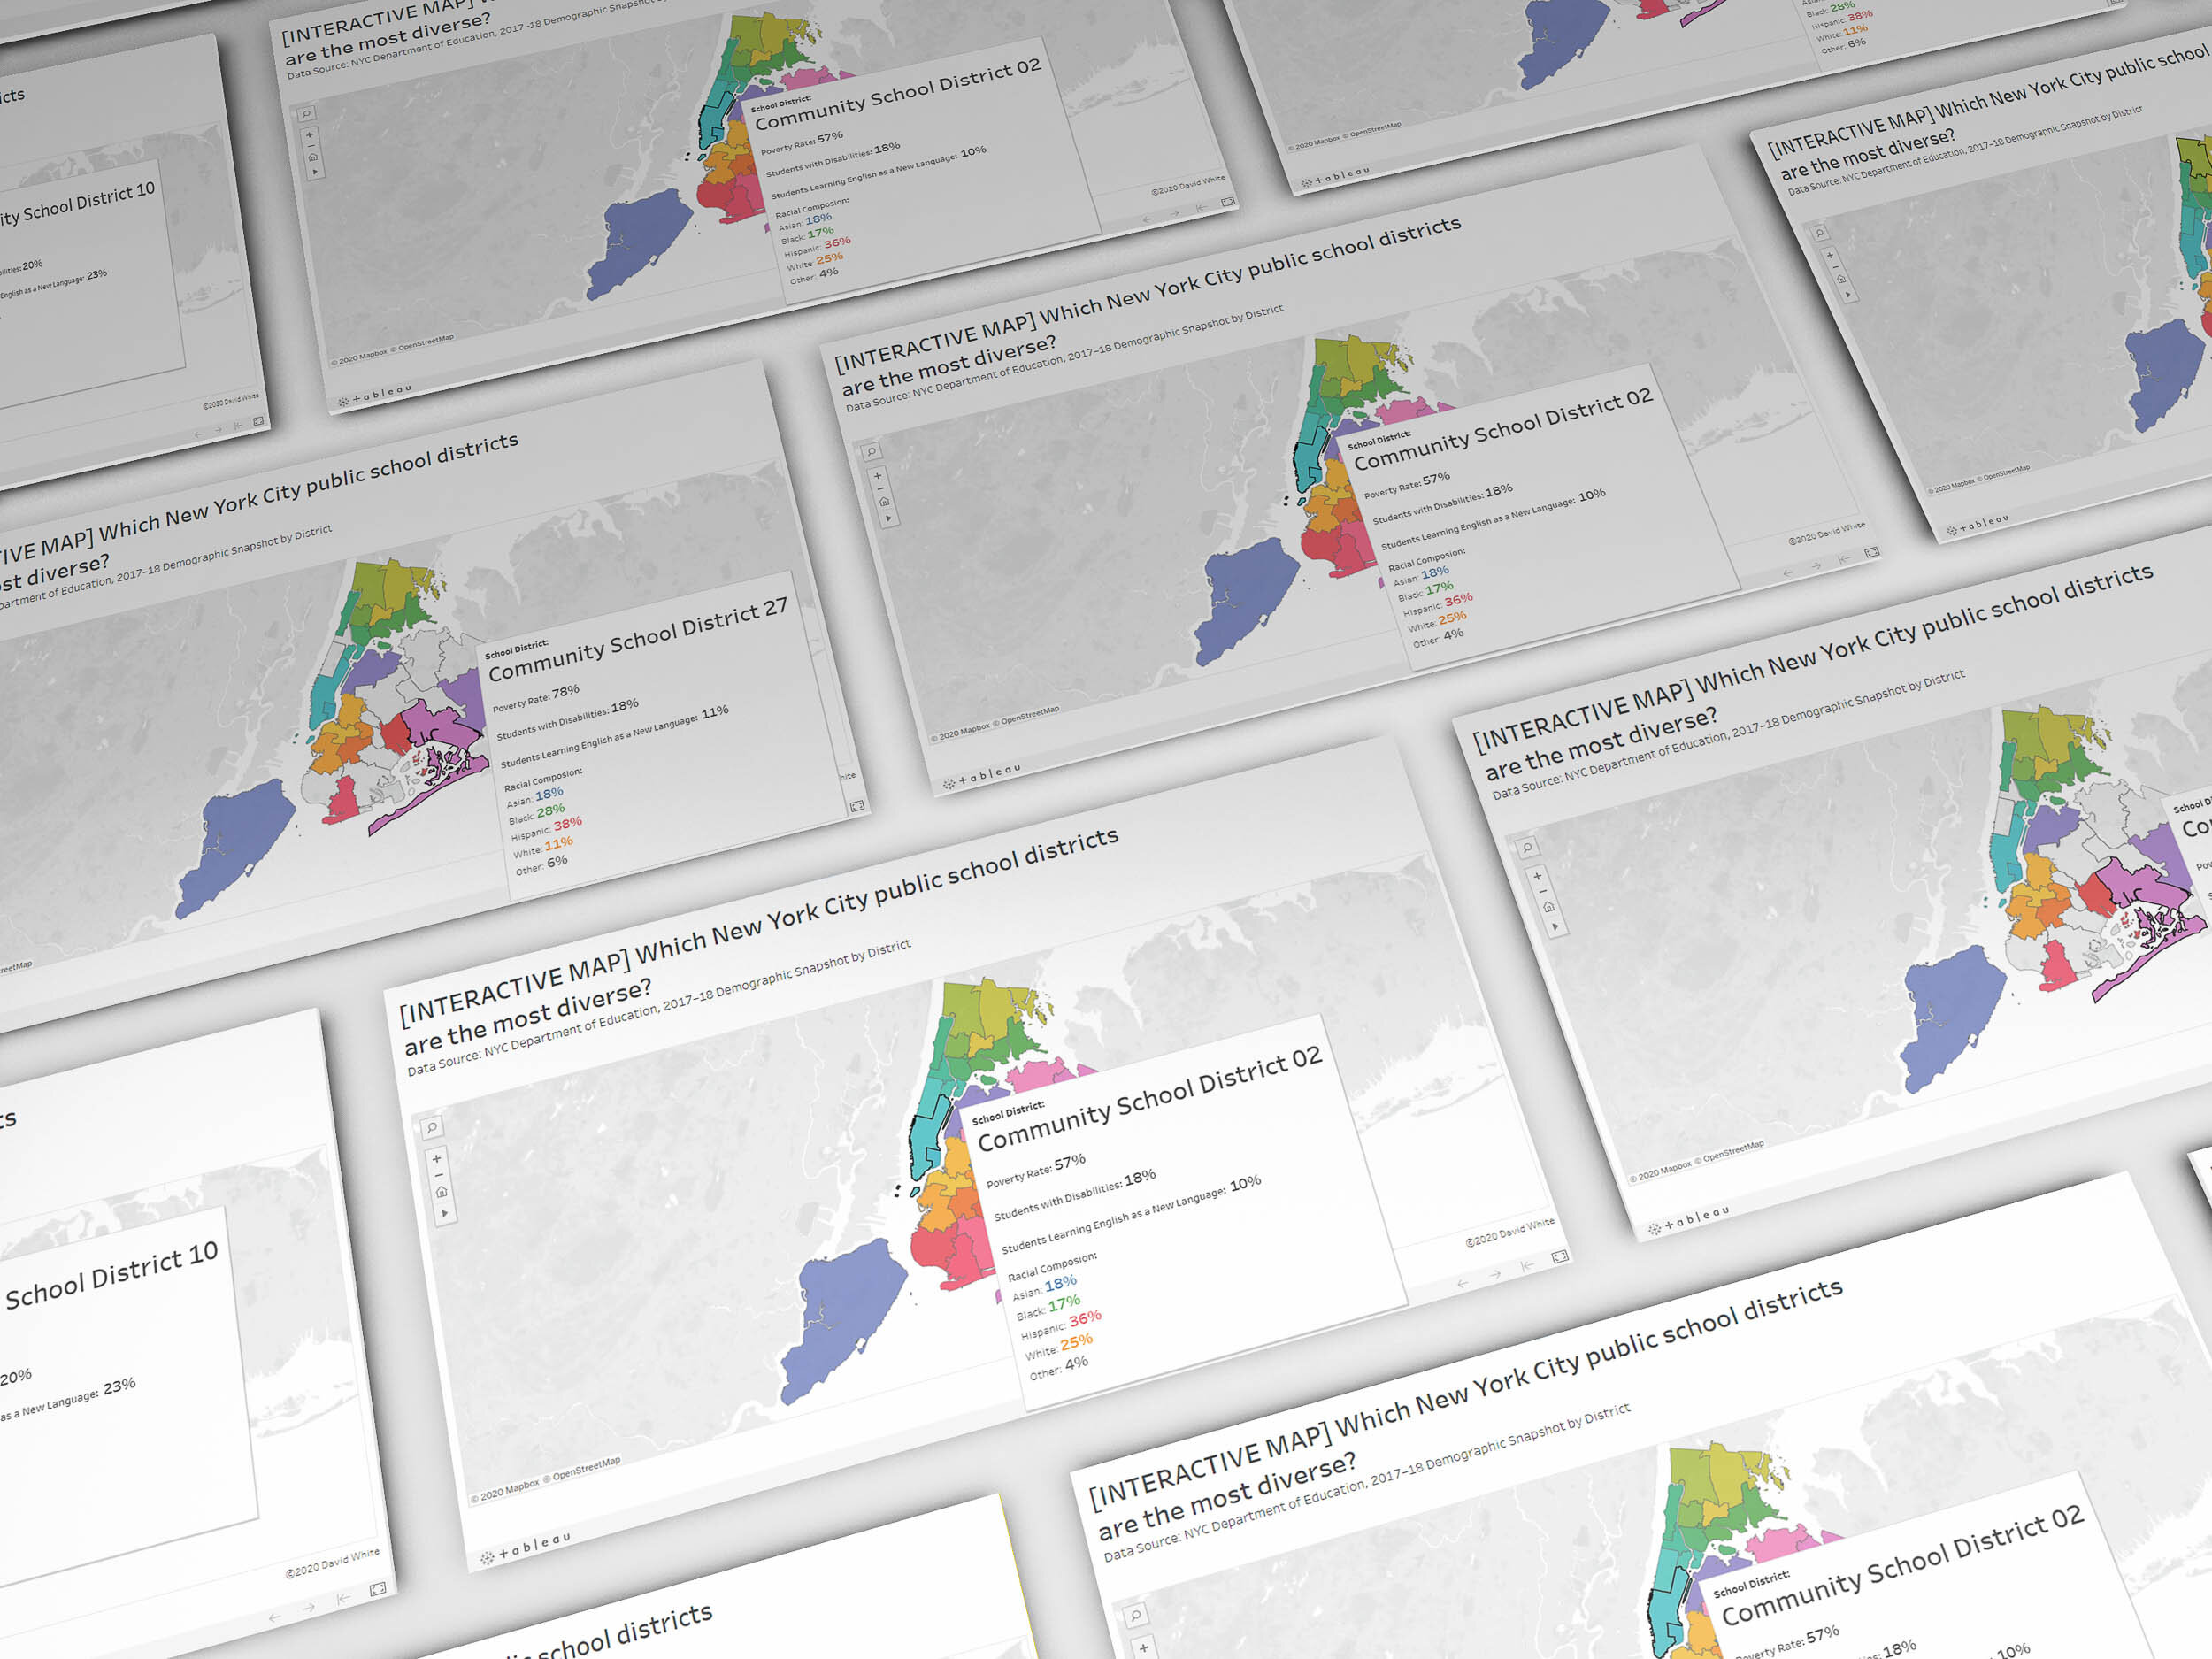
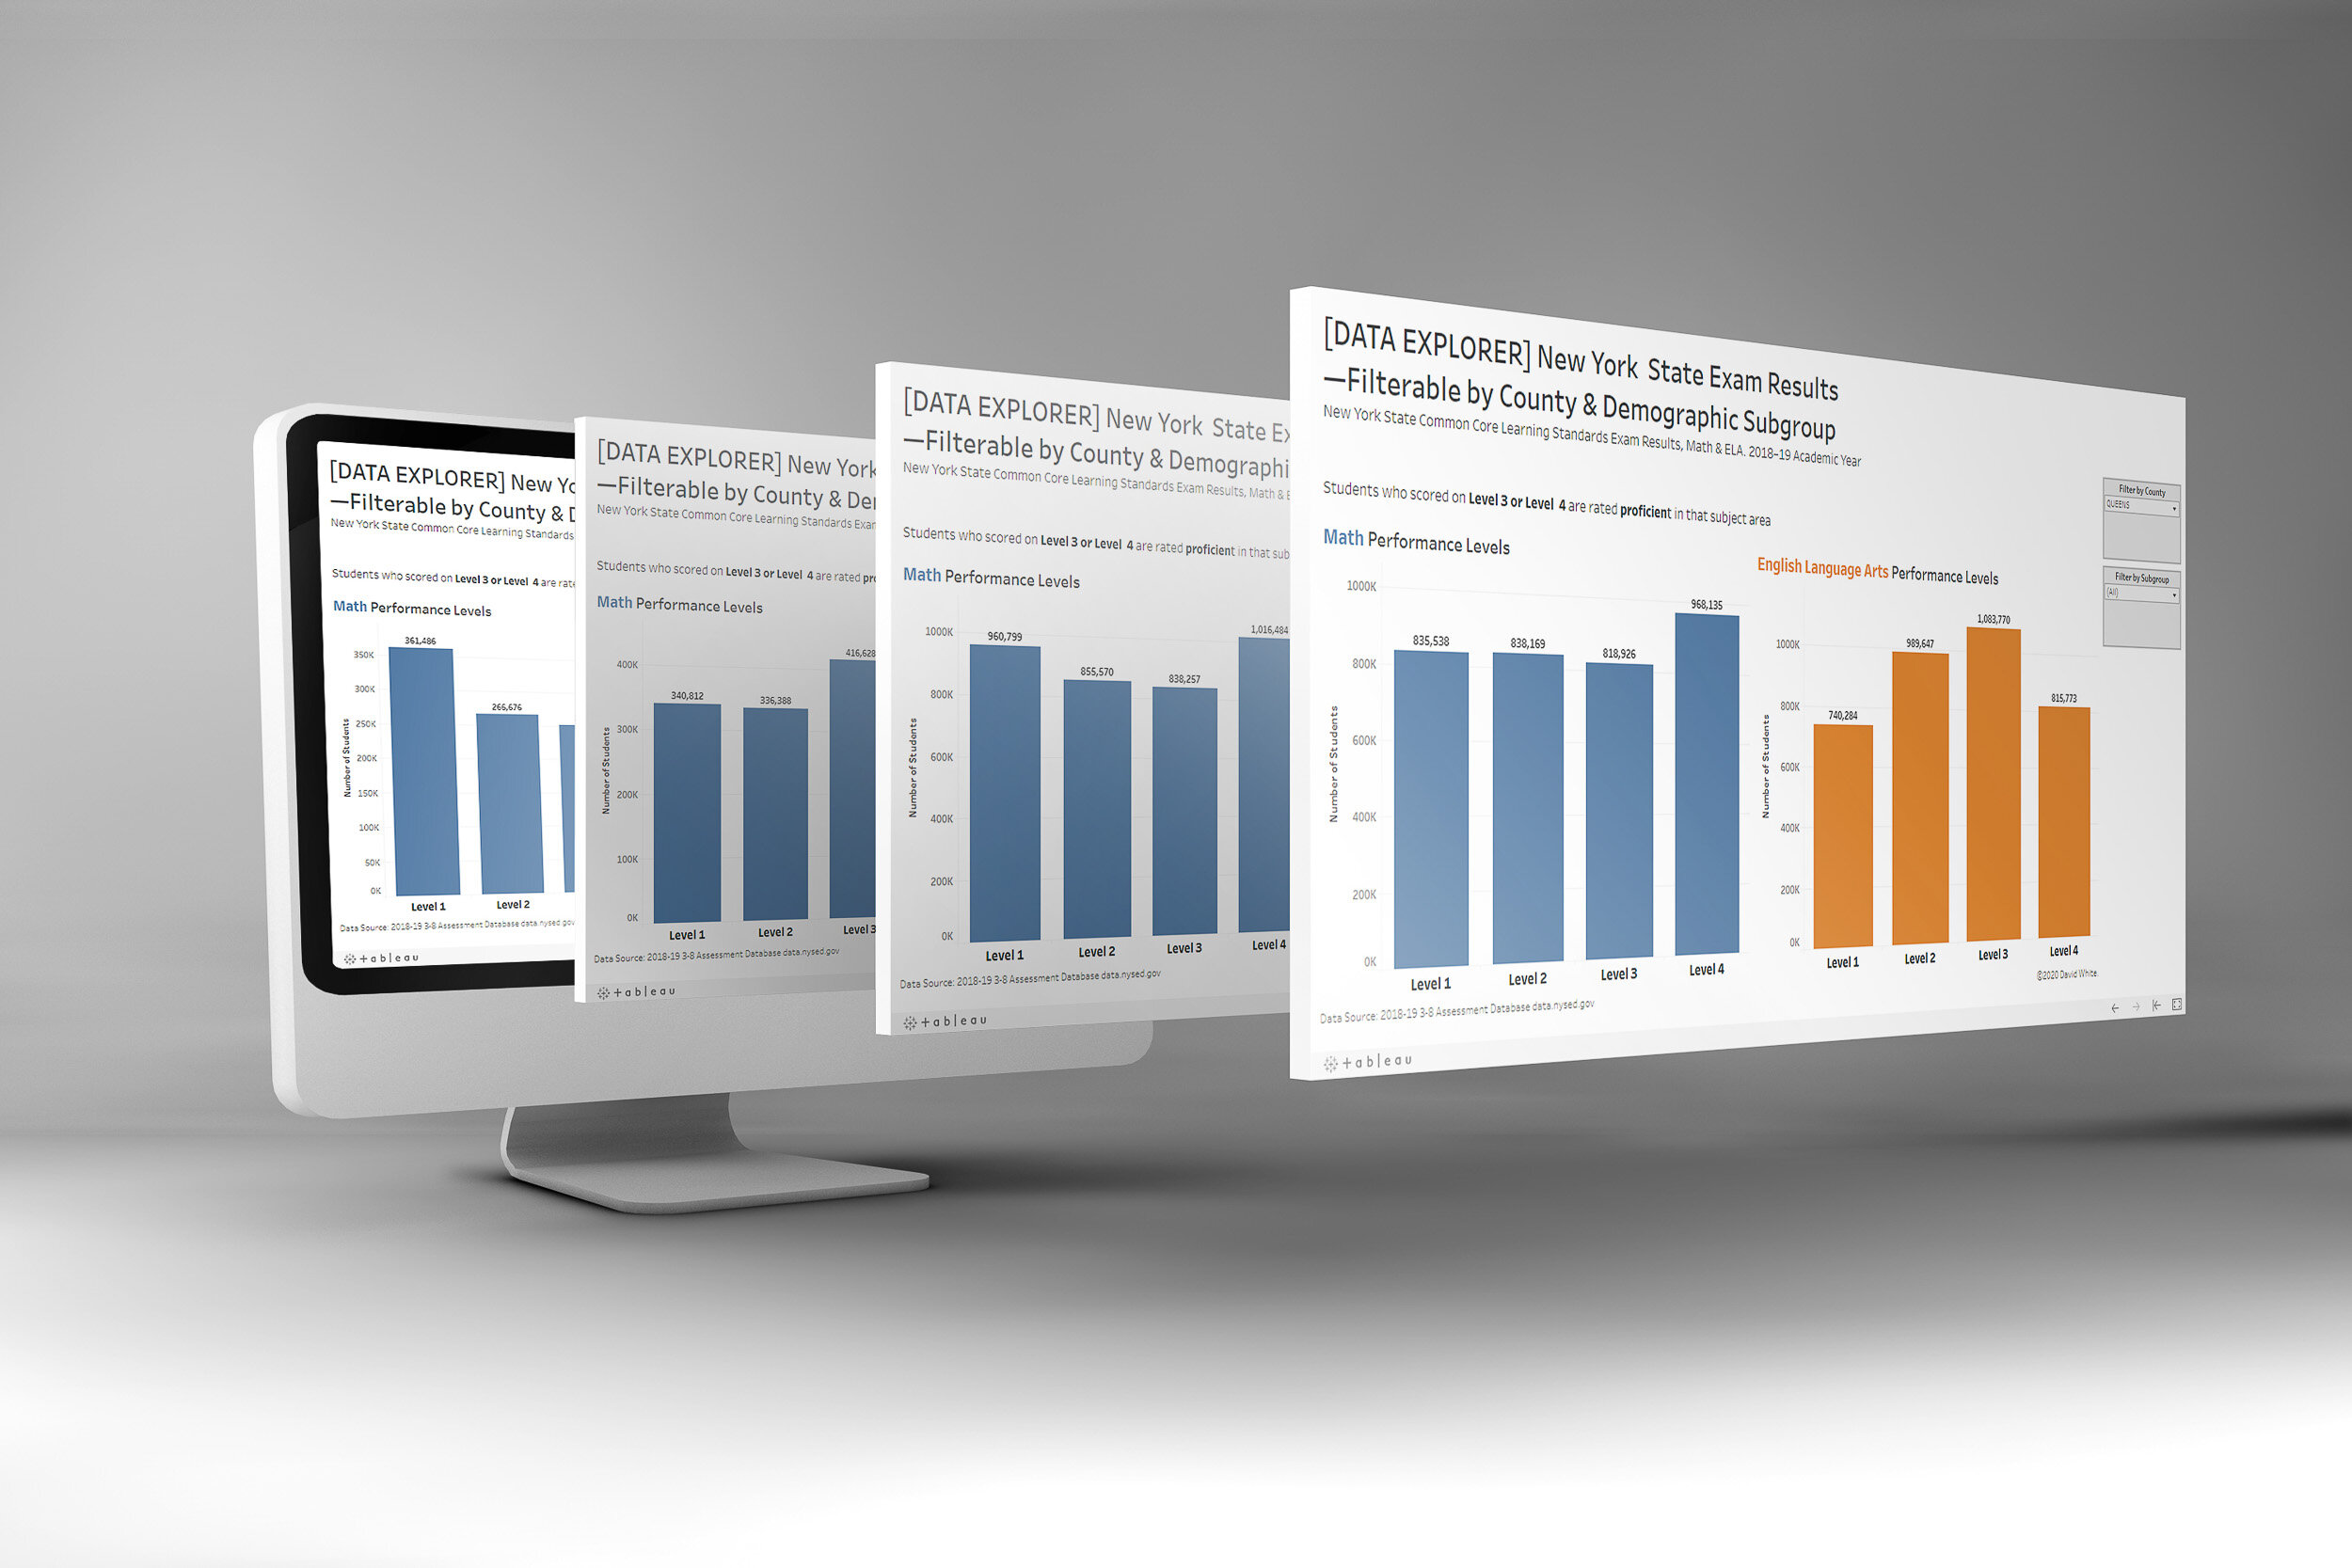
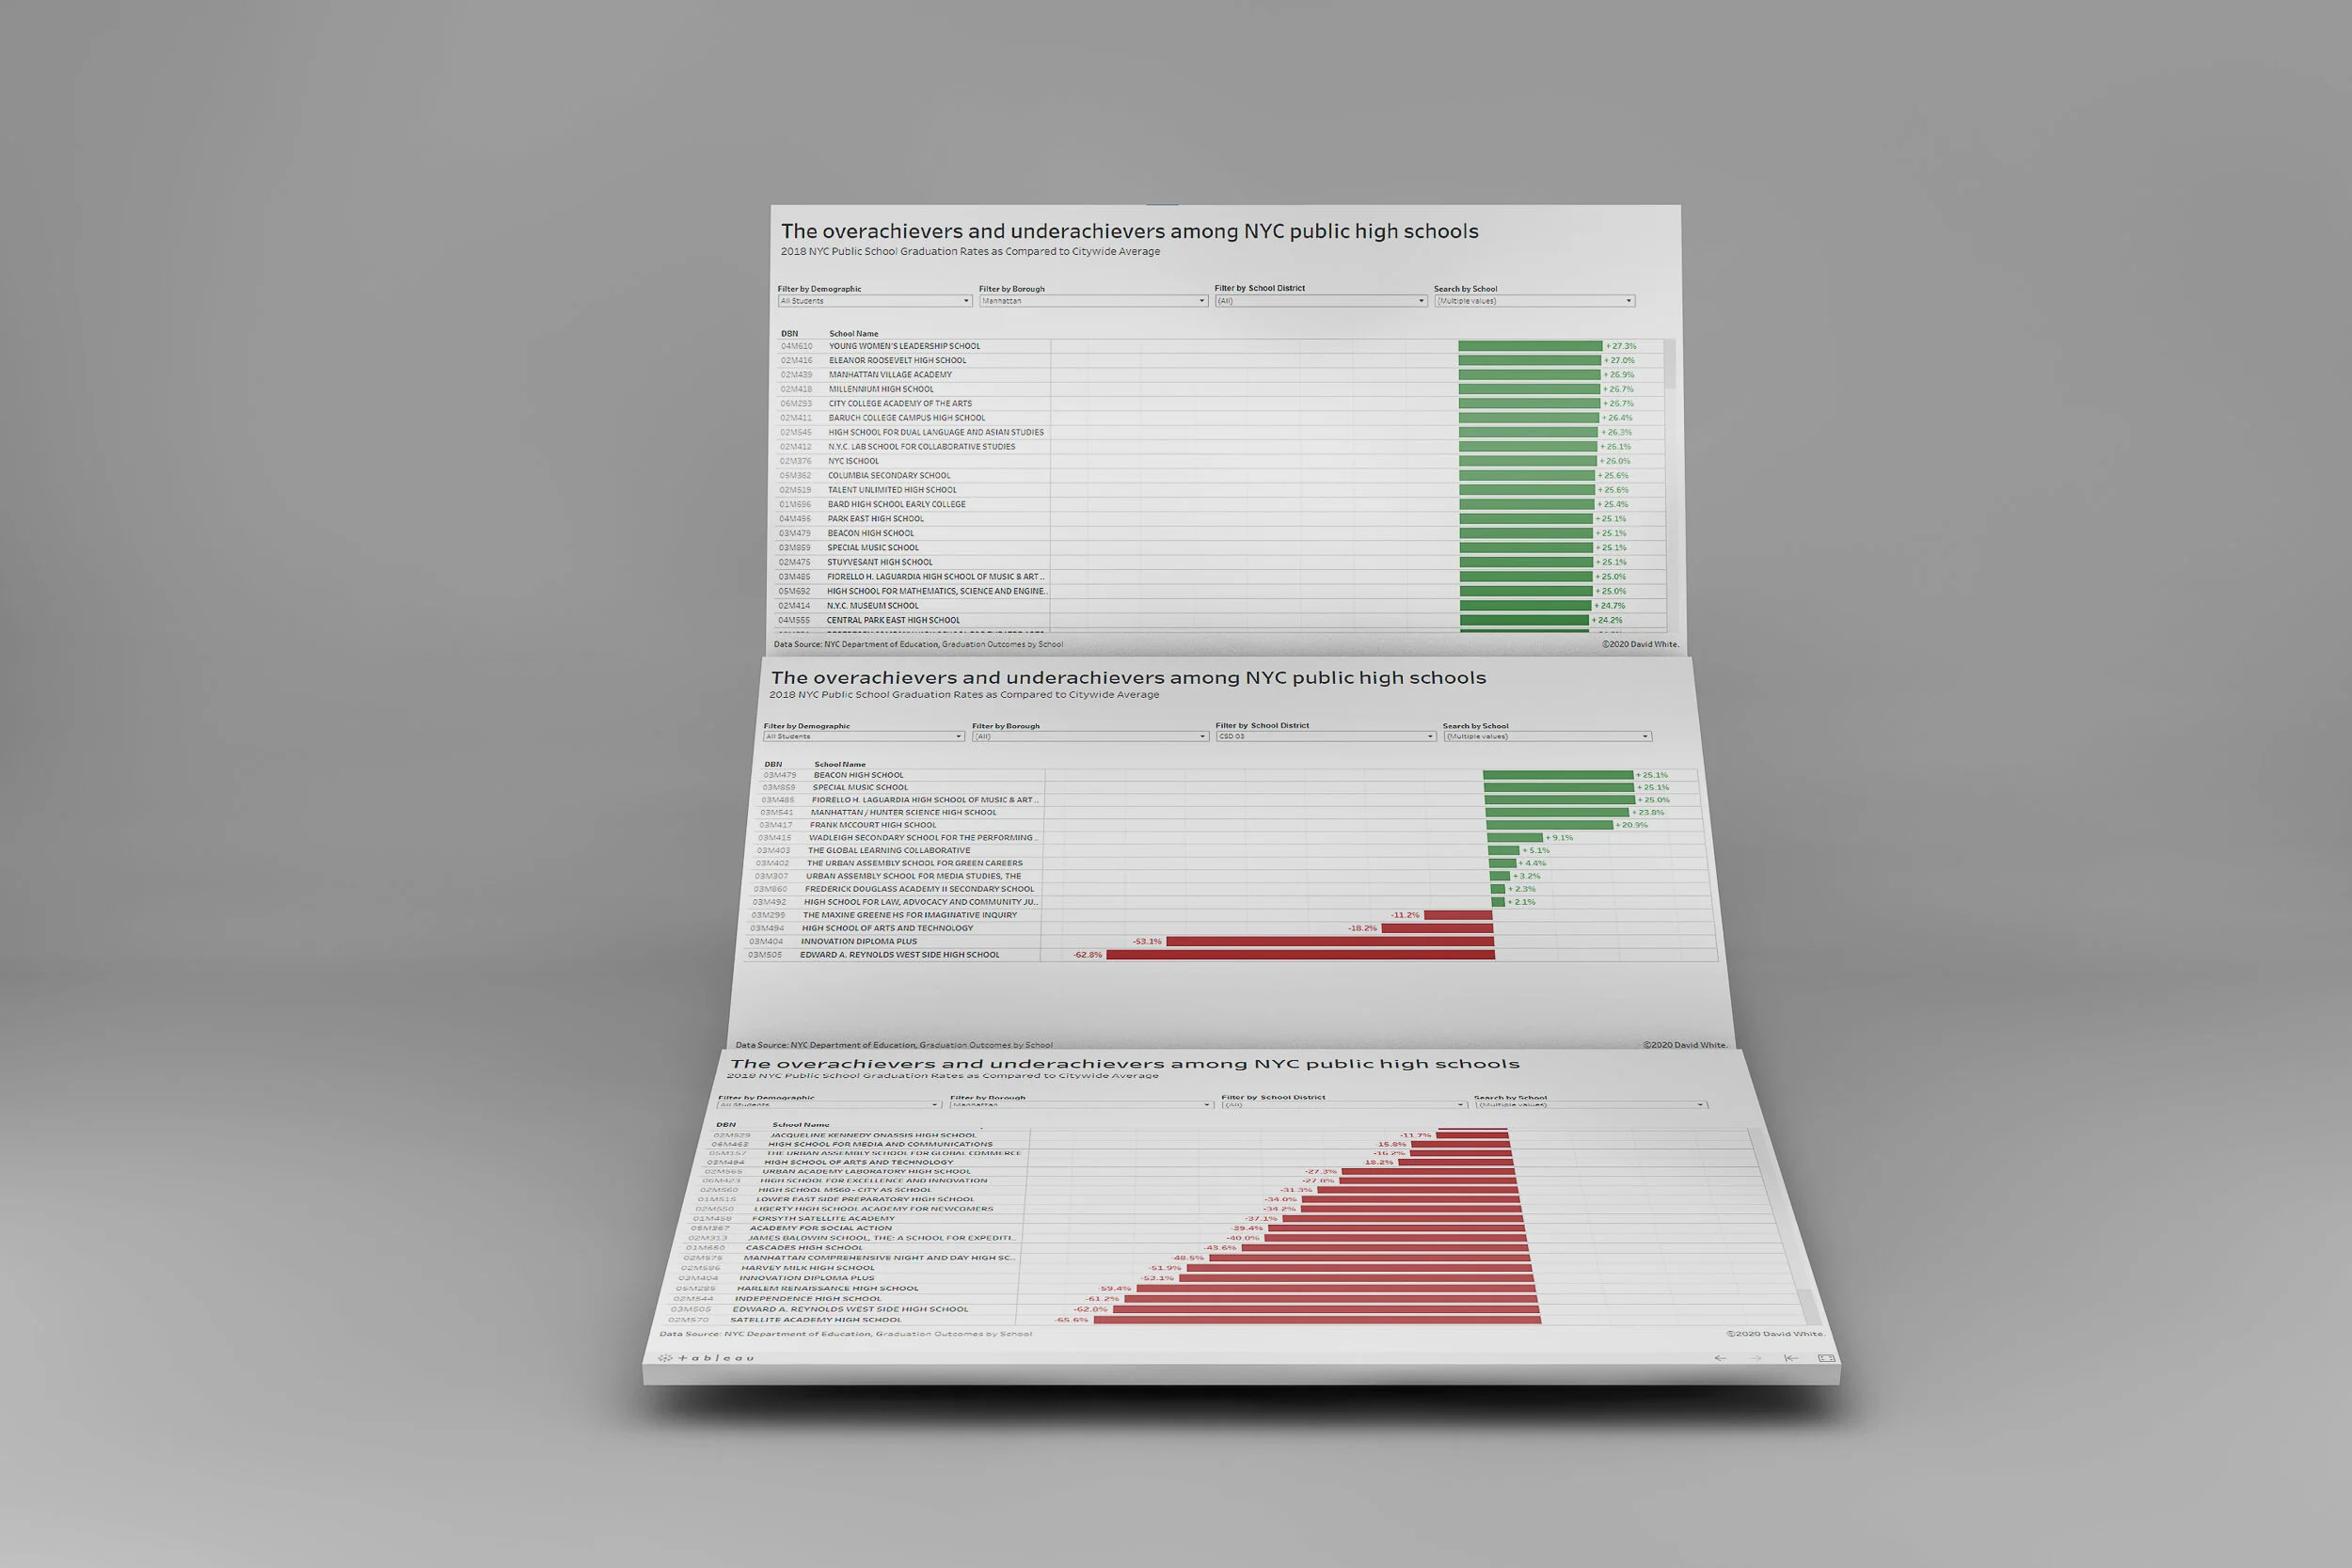
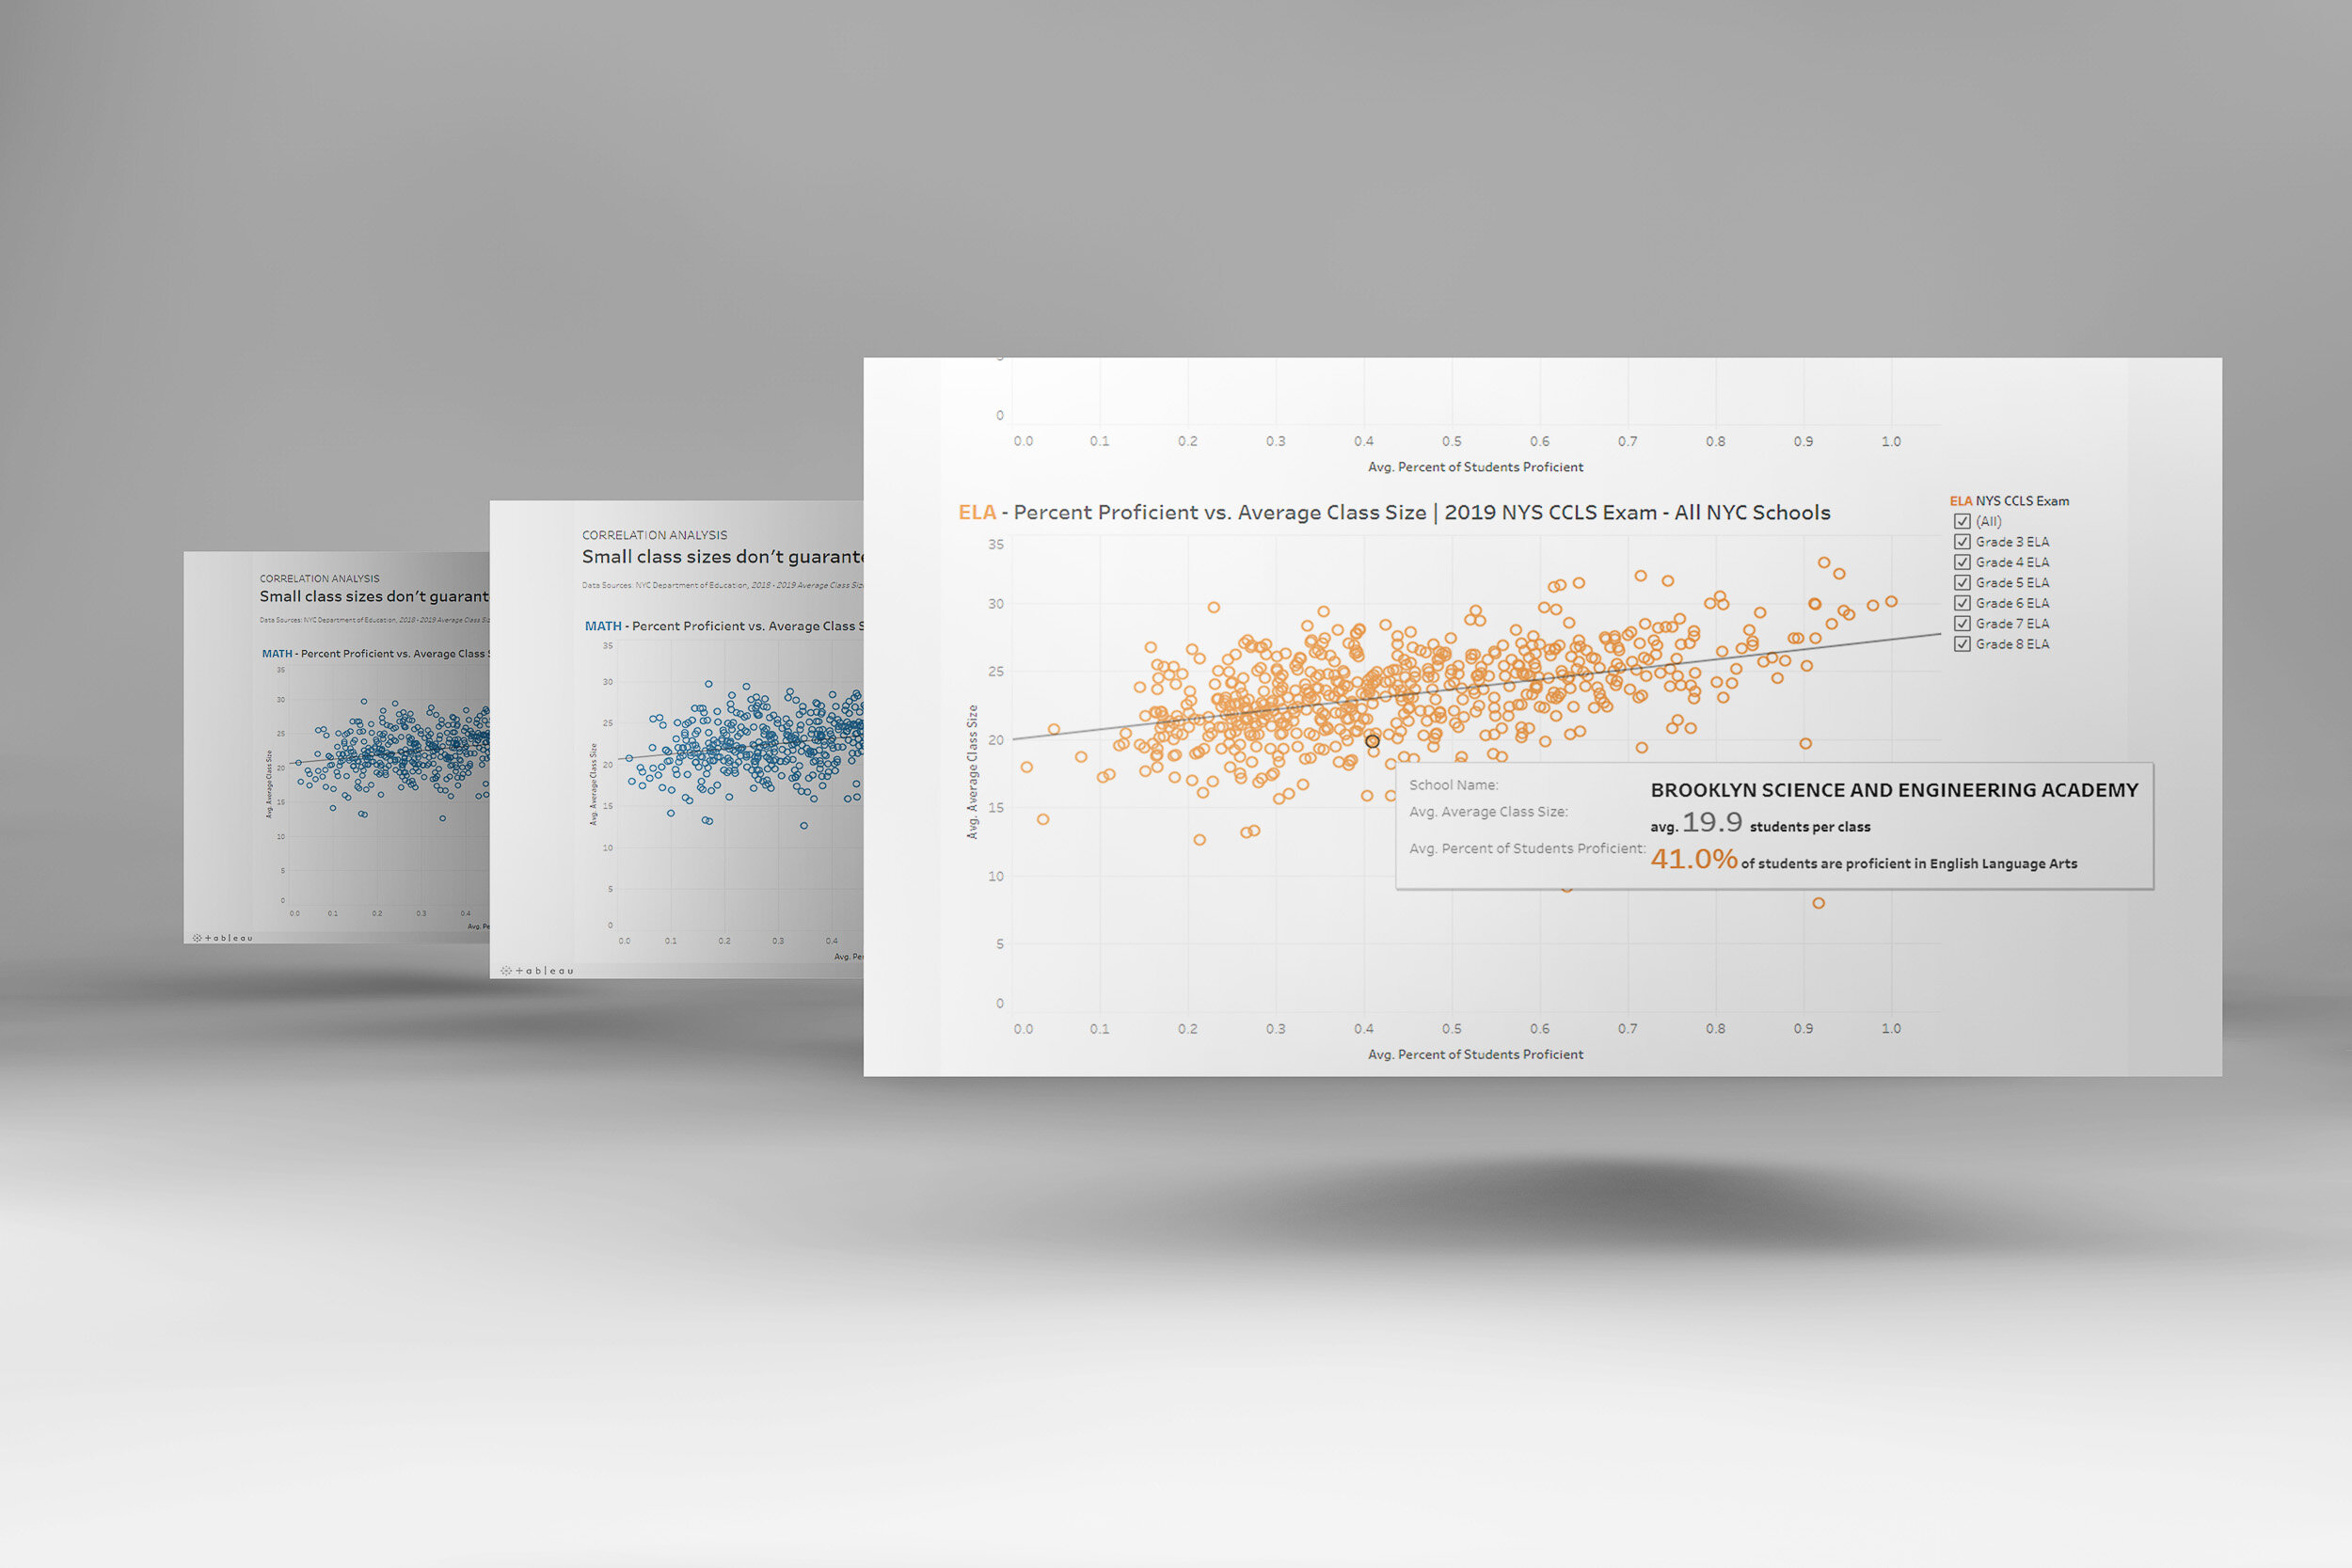
Challenges and Inequalities in Public Education
During the month of July 2021, I am using data analysis and visualization to explore the realm of public education. I am examining data on educational outcomes (such as graduation vs. dropout rates), spending on public education, public school staffing and the availability of educational services across different communities. Through these graphics, I aim to identify and surface some differences in both opportunity and outcome in the area of public education.