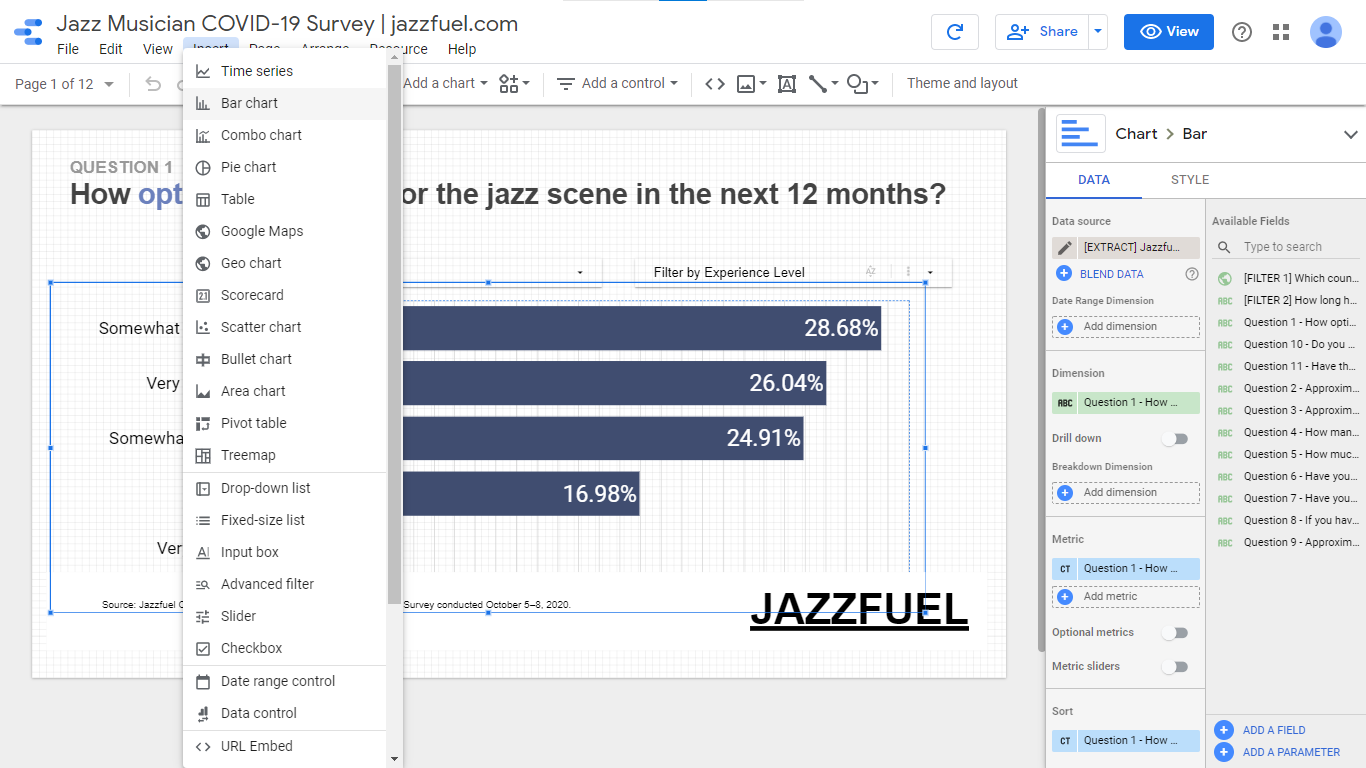
CSY-013. An interactive data visualization that communicates the results of a survey.
PROJECT COMPLETED: October 2020
THE STORY OF THIS PROJECT
Client’s Problem: “I recently completed a survey and now I need a way to analyze the results and share them with my audience.”
Jazzfuel.com is a professional development platform and online community that supports jazz artists in booking live performances, releasing recordings and promoting their work through traditional and social media.
In the fall of 2020, Matt Fripp, founder of jazzfuel.com, conducted a survey of the readers of his weekly newsletter to assess how the pandemic had impacted their livelihoods. He needed an analysis of the survey results and a user-friendly way to share that information. To solve these two problems, I designed and built an online interactive data visualization that communicated the findings of his survey.
Work Process:
Here’s the design process I used to complete this project—