Correlation
Correlation
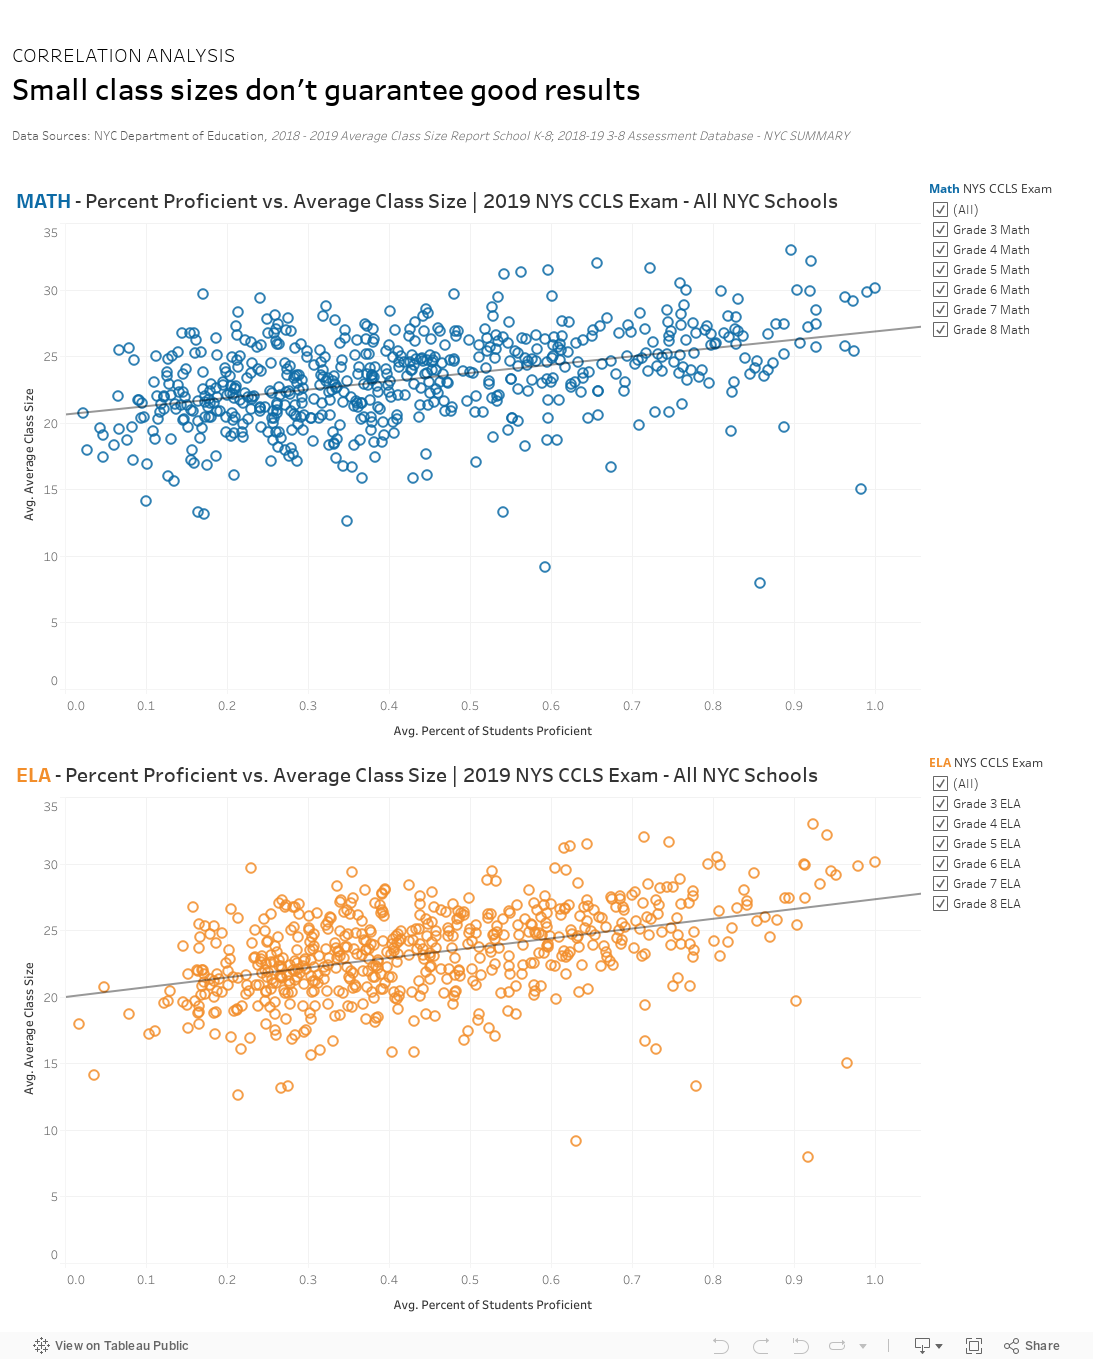
Correlation visualizations are graphs that show the relationship between two things.
My method:
First, I gather, clean up and plot the data. Then, I study the visualization I've created and I look for one of two things:
Is there a pattern where as one thing goes up, another thing also goes up?
-or-
Is there a pattern where as one thing goes up, another thing goes down?
When looking at a correlation visualization, if I don't find either of those things, it's a good bet that the two things I’m looking at are not in fact related to each other. (One is not affecting the other.) If I do find that there's a relationship between two things, then the question becomes “Did one of these things influence (or cause) the other?”
In any real-life scenario there are many, many things happening all at once. In these complex situations, my way of revealing the bigger picture is to put a spotlight on a pair of variables (just two specific things) at a time. Then I repeat that inquiry process until I’ve looked at the situation from every angle. Eventually, that uncovers the truth.
Exemplar Correlation Data Visualization by David White