Tuesday, July 27, 2021 There is a wide variance of average class sizes among states across the country.…Read More Read More blog posts, data visualizationDavid WhiteJuly 27, 2021part-to-whole, magnitude, Tableau, July 2021 - Challenges & Inequality in Public Education
Monday, July 26, 2021 Hawaii was the state with the highest percentage of non-white public school students with 88%…Read More Read More blog posts, data visualizationDavid WhiteJuly 26, 2021part-to-whole, 100% bar graph, Tableau, July 2021 - Challenges & Inequality in Public Education
Tuesday, July 20, 2021 Most NYC charter school graduates earned standard Regents diplomas…Read More Read More blog posts, data visualizationDavid WhiteJuly 20, 2021part-to-whole, bar graph, Tableau, July 2021 - Challenges & Inequality in Public Education
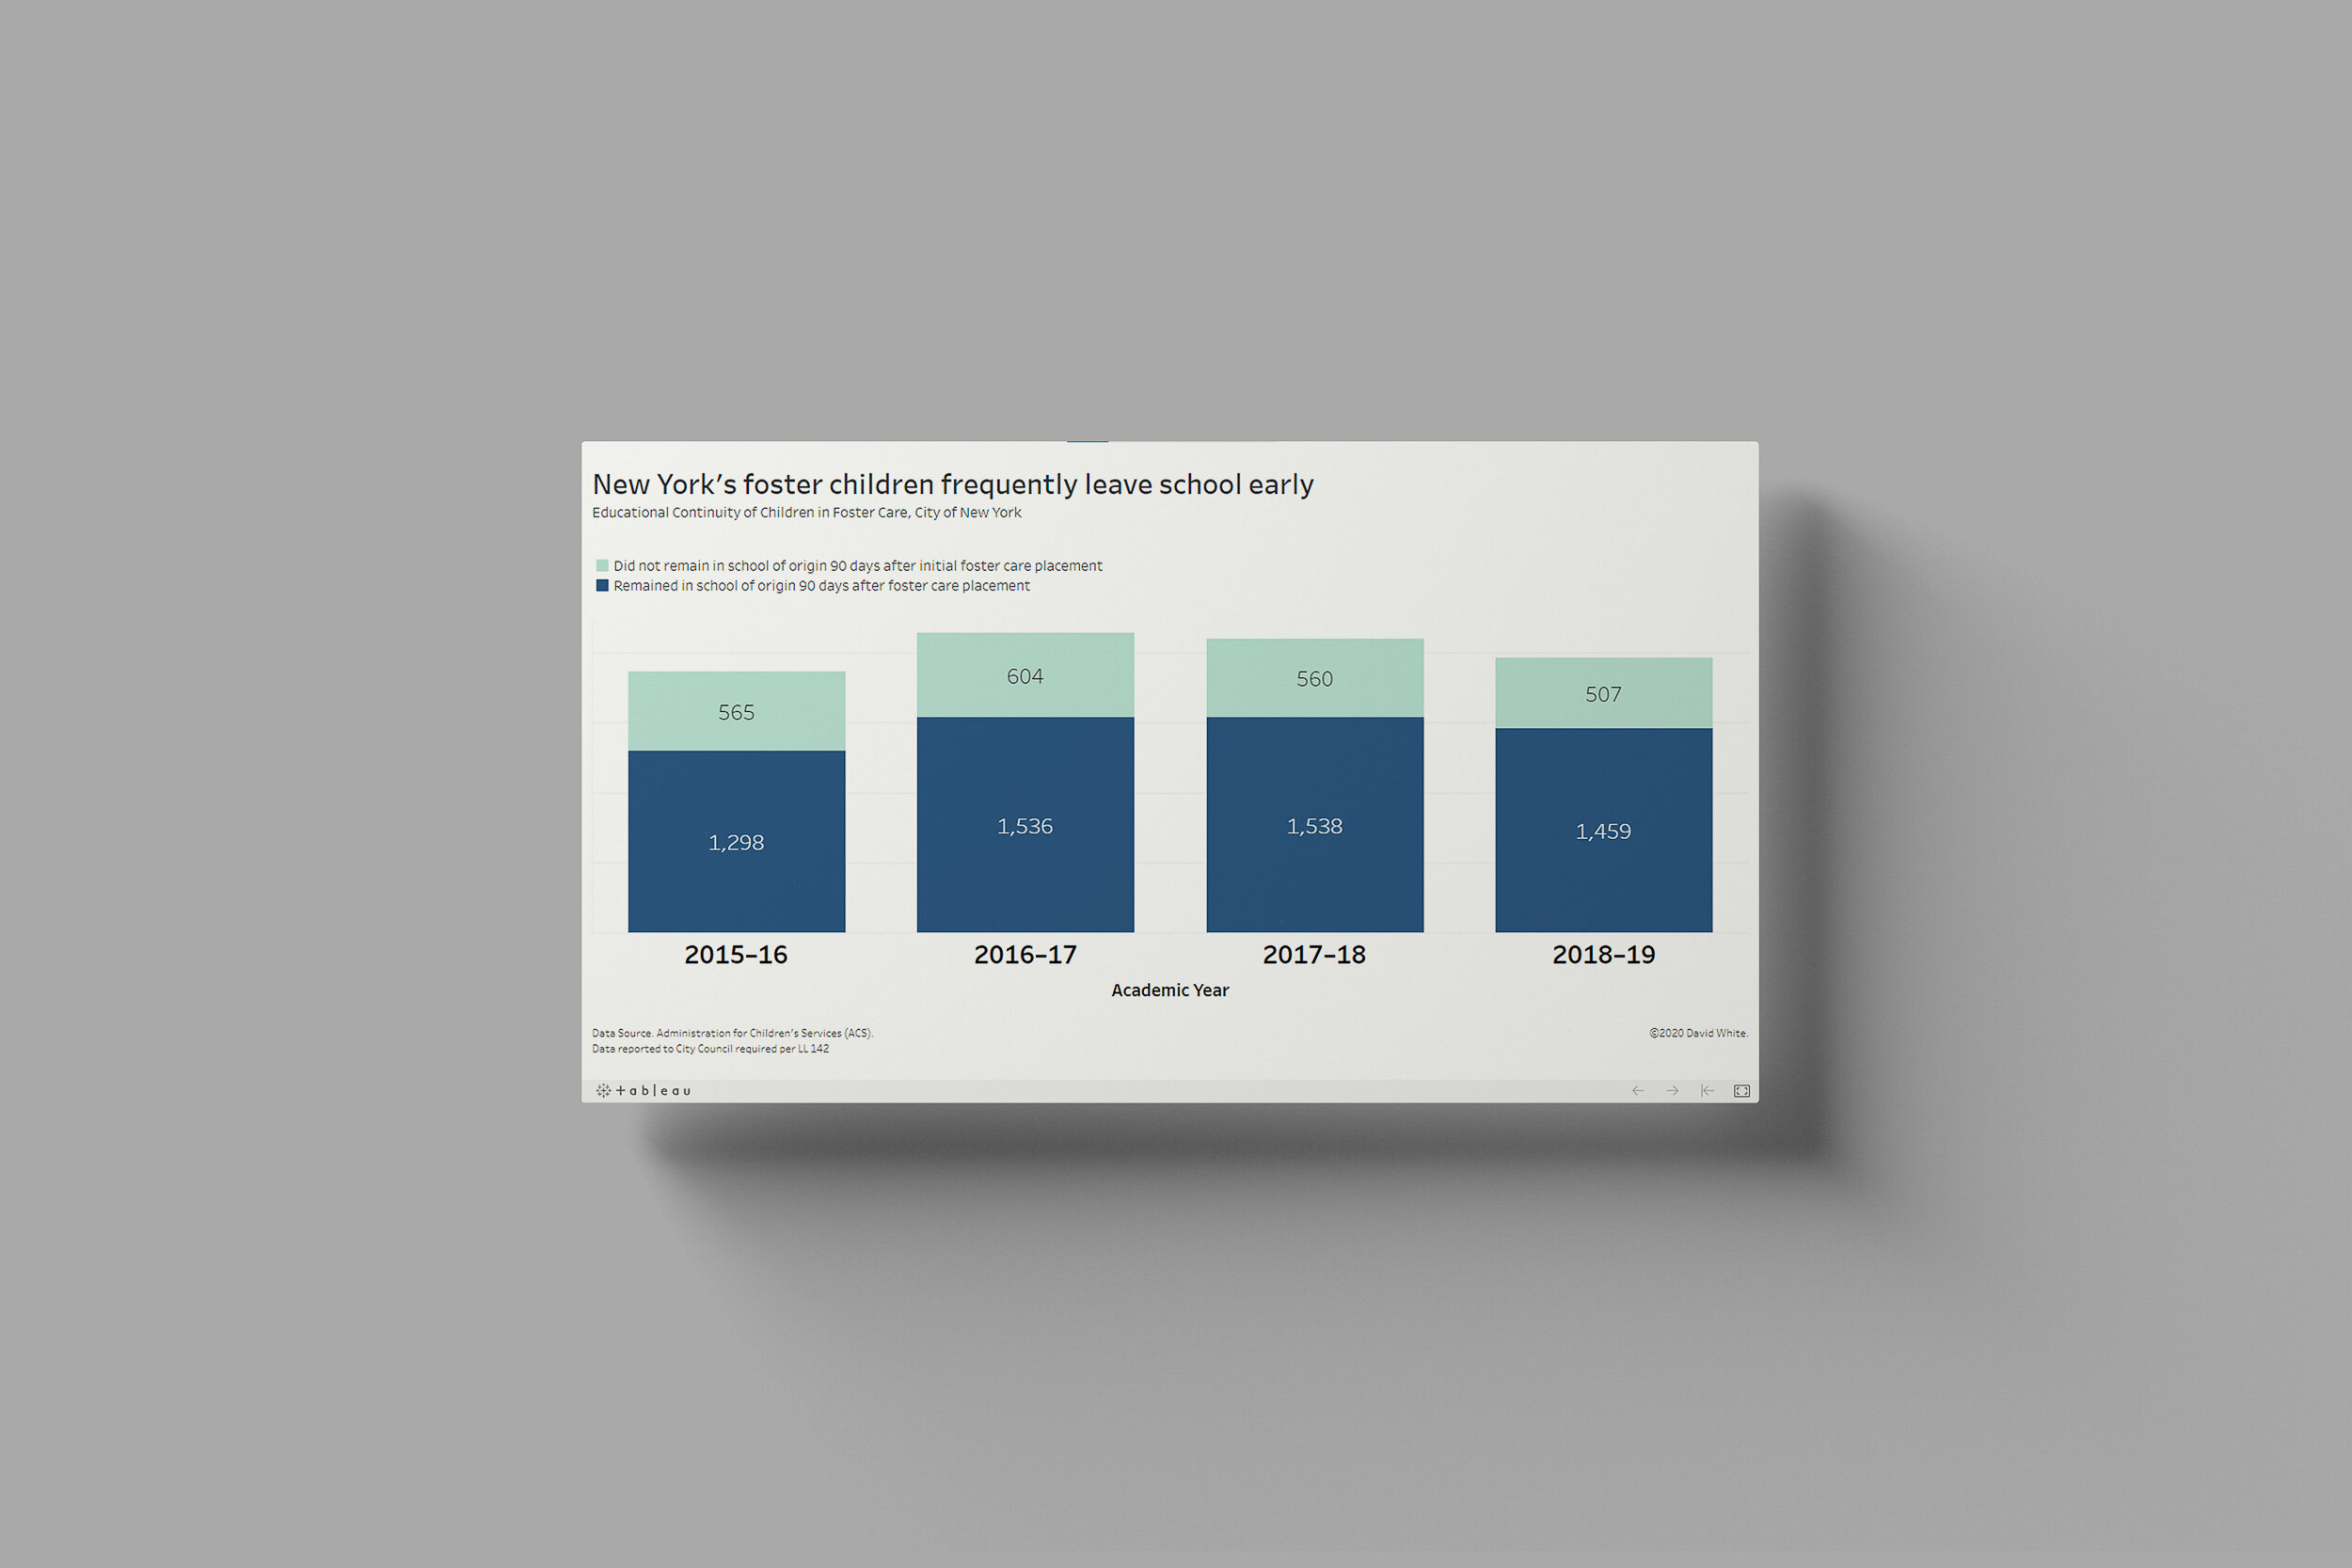
Friday, July 16, 2021 Forster children face significant challenges when it comes to schooling…Read More Read More blog posts, data visualizationDavid WhiteJuly 16, 2021part-to-whole, change-over-time, bar graph, Tableau, July 2021 - Challenges & Inequality in Public Education
Wednesday, July 7, 2021 Charter schools dominate the conversation, but not the enrollment numbers…Read more Read More blog posts, data visualizationDavid WhiteJuly 7, 2021part-to-whole, 100% bar graph, Tableau, July 2021 - Challenges & Inequality in Public Education