Spatial
Spatial
Spatial graphs are data visualizations that show two things at once: (1) How much of something there is and (2) Where in the world it's located.
My method:
First, I gather, clean up and plot the data. Then, I study the visualization I've created and I look for four things:
Are there any extremes in the data? (Is there anything that is very high or very low?)
Which places have similar results?
Follow-up question: What do these places have in common?
Is there anything shown in the data that is not what I expected to find?
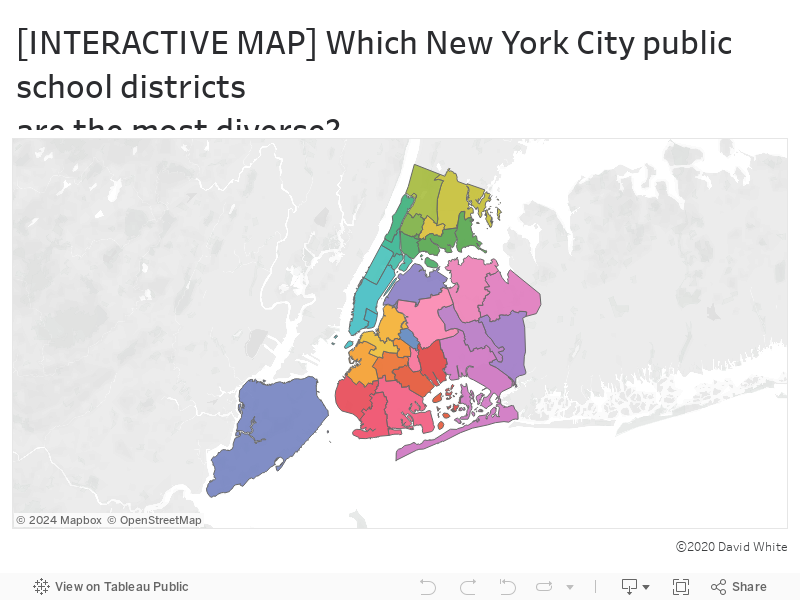
Exemplar Spatial Data Visualization by David White