Part-to-Whole
Part-to-Whole
Part-to-whole visualizations are graphs that show how big an individual piece is as compared to the size of the whole.
My method:
First, I gather, clean up and plot the data. Then, I study the visualization I've created and I look for several things:
Is there any piece that takes up close to 100% of the whole?
Is there any piece that is very small and takes up close to 0% of the whole?
How many different different pieces are there in thing I’m looking at?
Do these pieces look like they form clusters or is each piece pretty much on its own?
If there are clusters, are all of them about the same size or are some much larger or smaller than others?
Is there anything shown in the data that is not what I expected to find?
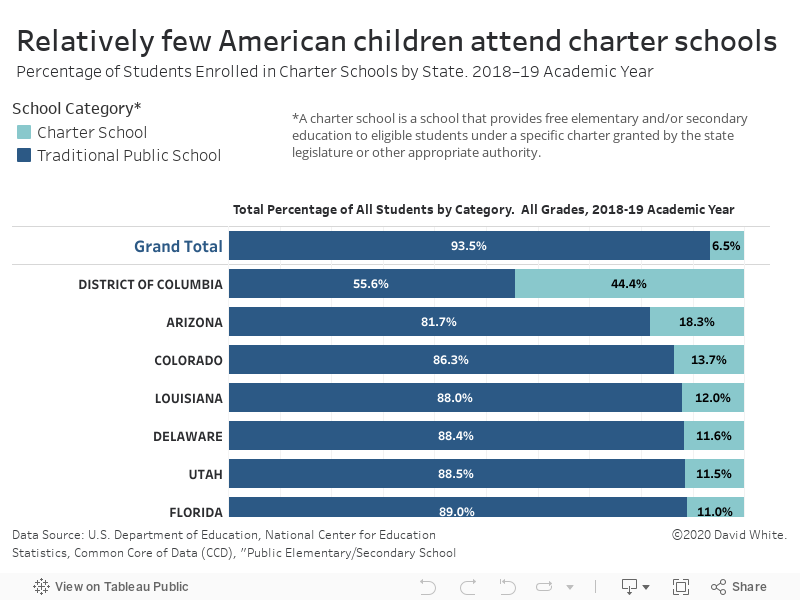
Exemplar Part-to-Whole Data Visualization by David White