Flow
Flow
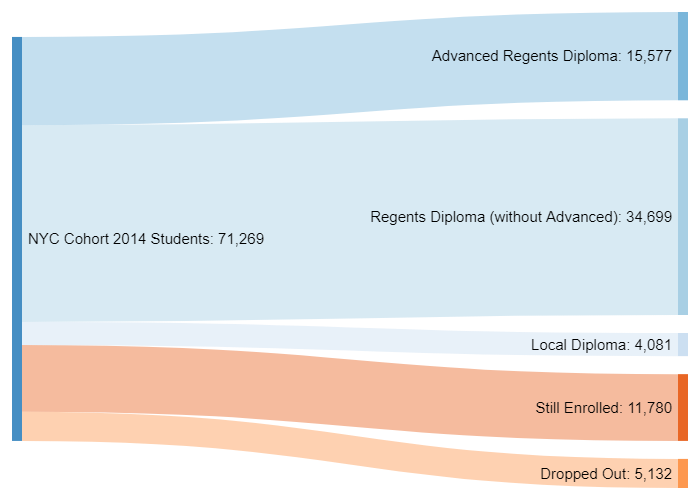
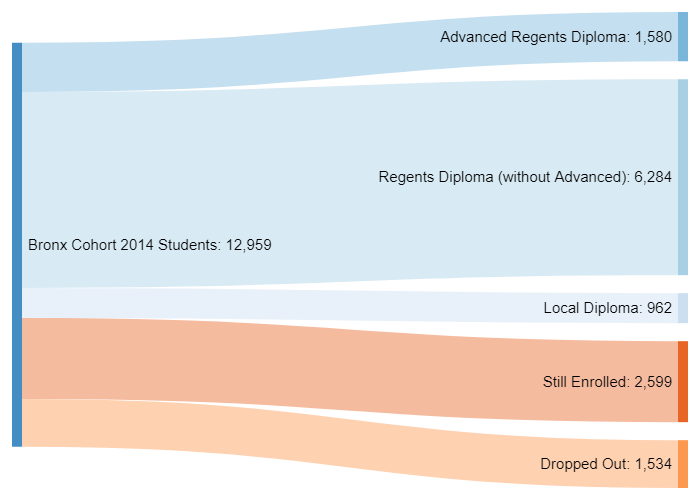
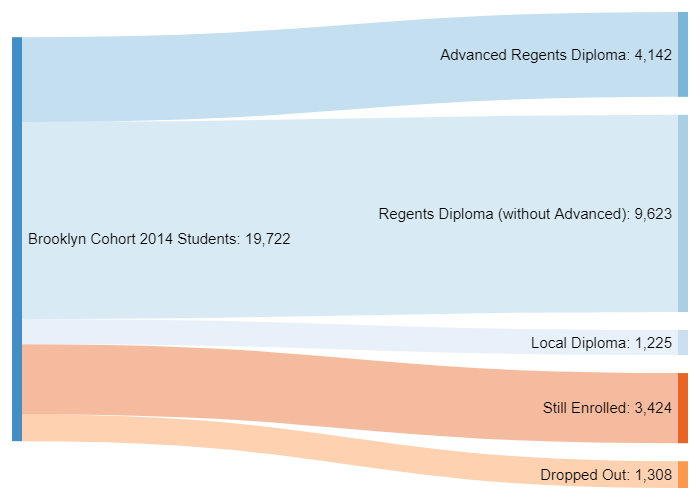
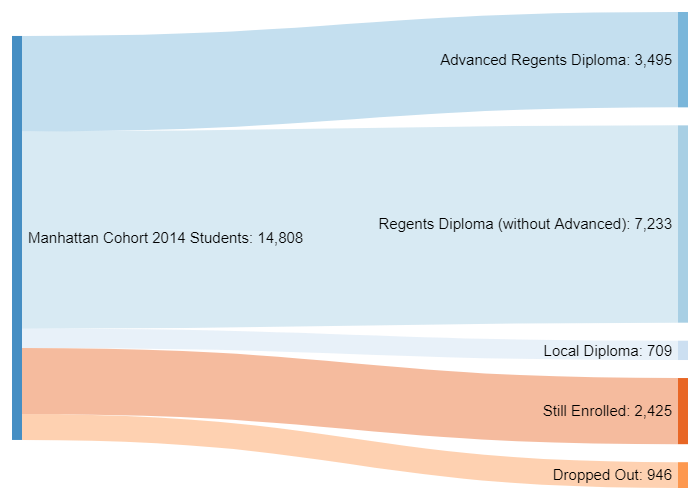
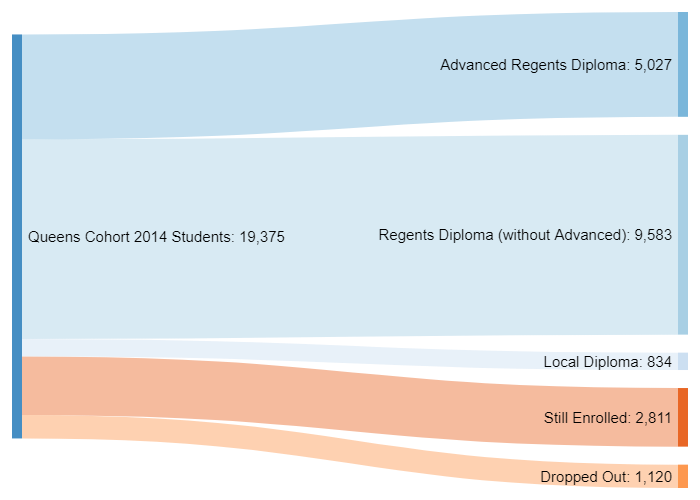
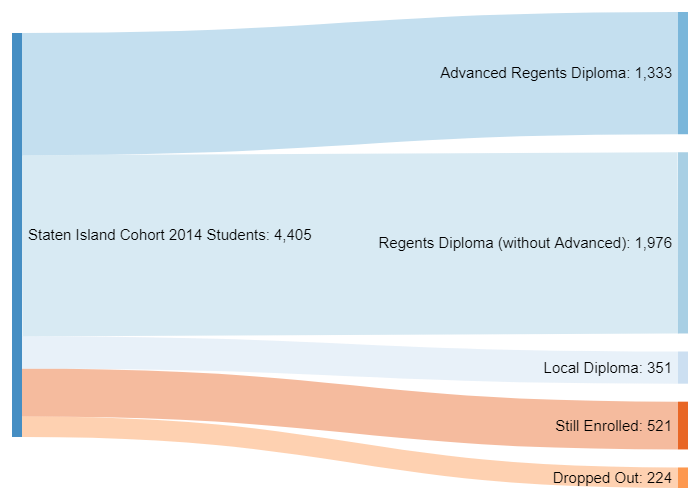
Flow charts illustrate movement through a cycle from start to finish. They’re similar to change-over-time visualizations except that they are typically used to describe a process that's repeated over and over again.
My method:
First, I gather, clean up and plot the data. Then, I study the visualization I've created and I look for two things:
Were there any noticeable changes from start to finish?
Did something change that I expected would stay the same? (Or vice versa?)
Exemplar Flow Data Visualization by David White